Gold Price Forecast: XAU/USD plunged towards $1900, on Fed’s holding rates higher as US yields soar
- Gold prices tumble as high US bond yields, and a strengthening US Dollar create a challenging environment for the precious metal.
- The US 10-year TIPS yield, indicative of real yields, has reached fourteen-year highs at 2.236%, last seen in July 2009, further pressuring gold prices.
- Speculations of the Federal Reserve maintaining higher interest rates for an extended period continue negatively impacting Gold.

Gold price tumbled towards $1900 on Tuesday, weighed by high US bond yields underpinning the Greenback (USD) as traders brace for the Fed’s mantra that would keep rates “higher for longer.” Therefore, XAU/USD is falling after hitting a daily high of $1916.89 and is trading at $1901.16, down 0.76%.
Gold prices face downward pressure as traders anticipate prolonged high-interest rates, with XAU/USD trading at $1901.16, marking a 0.76% decline
Wall Street is trading in red territory, while US bond yields advance. One of the main drivers of Gold weakness is the US 10-year TIPS (Treasury Inflation-Protected Securities) yield, a proxy for real yields, which rose to new fourteen-year highs at 2.236%, a level last seen in July 2009. At the same time, the US Dollar Index, which tracks the performance of six currencies against the US Dollar, climbs to 106.17, up 0.21%, after hitting a new year-to-date (YTD) high of 106.20.
Last week’s Fed's decision to hold rates unchanged but upward revising interest rates in the United States (US) in 2024 from 4.6% to 5.1% caught off guard traders, expecting rate cuts by the Fed at around July of next year. Hence, as they scramble through the doors, they are beginning to price in a scenario of higher rates, as could be seen by the financial markets’ reaction.
Additionally, although Fed officials stressed that patience is required, the majority is ready to raise rates again, as inflation, per the latest report, increased to 3.7%, as shown by the Consumer Price Index (CPI). It should be said the recent rally in oil prices, could pave the way for another inflation spiral, as West Texas Intermediate (WTI), the US crude oil benchmark, is trading near the $90,00 per barrel mark.
Data-wise, the Conference Board (CB) reported that consumer Confidence reached a four-month low, as the index declined to 103 from 108.7 in August, and below estimates of 105.5. The decline is attributed to a deteriorating economic outlook for the overall economy.
Earlier, housing data was revealed, as August’s Building Permits in the US increased from July's 1.443 million to 1.541 million, indicating continued growth in construction. However, the housing market shows signs of weakness as New Home Sales plummeted by -8.7% compared to the 8% increase in July. The decline is mainly due to higher mortgage rates, as the Federal Reserve embarked on an aggressive tightening cycle that witnessed interest rates hit the 5.25%-5.505 area.
Ahead of the week, the US economic docket would feature the release of Durable Goods Orders, Initial Jobless Claims, GDP, the Fed’s inflation gauge, and the core PCE alongside Fed speakers.
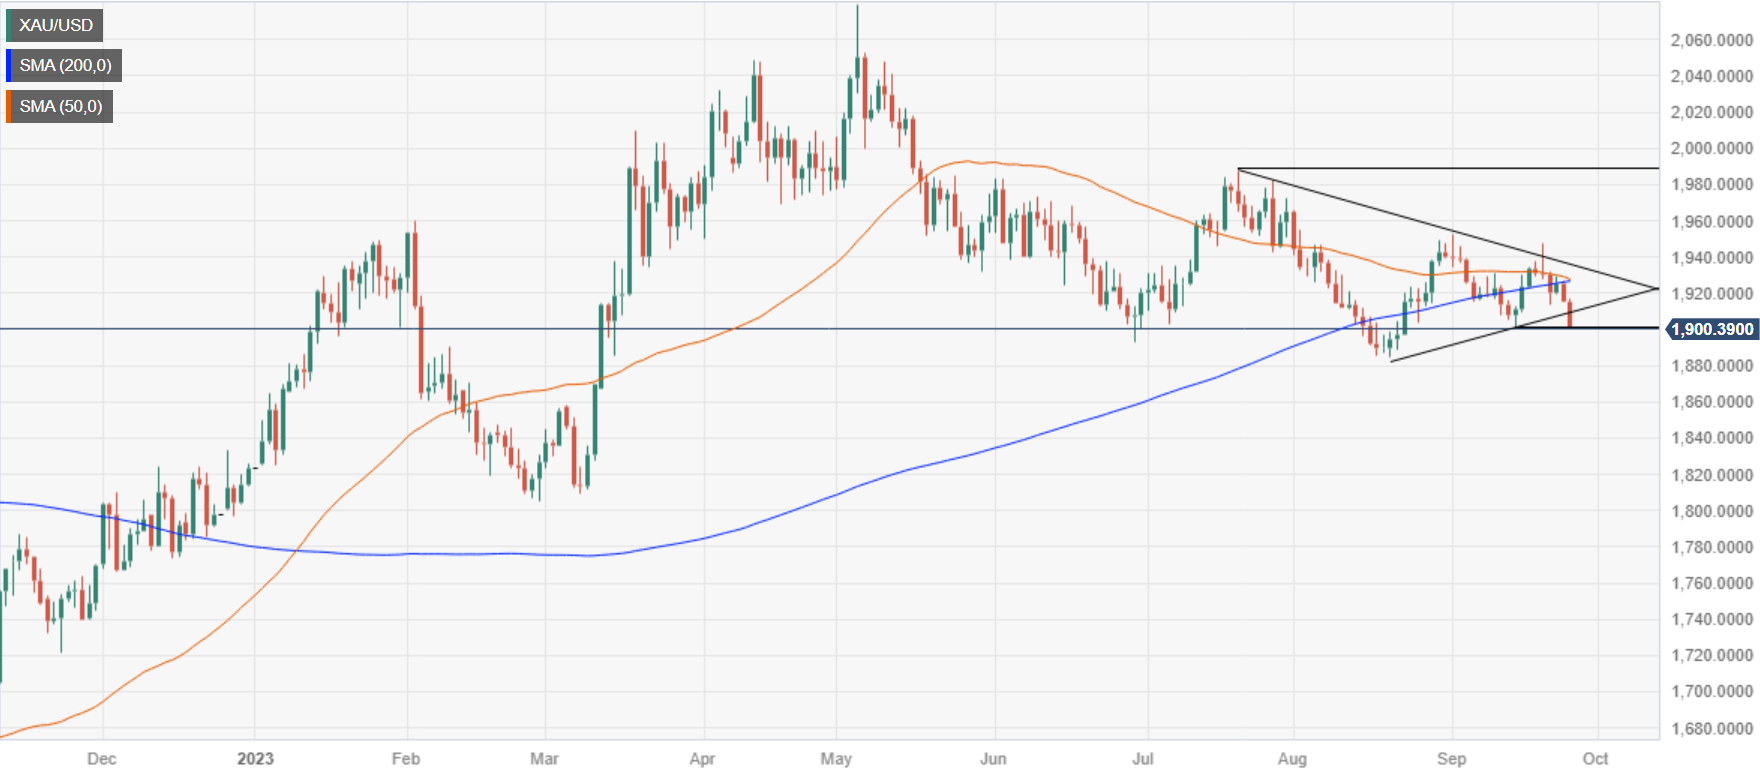
XAU/USD Price Analysis: Technical outlook
The XAU/USD daily chart portrays the yellow metal is set to extend its losses though pending to pierce below the $1900 figure, which could open the door to test August 21, the last cycle low at $1884.89, before extending its losses towards the next support seen in March 8 daily low of $1809.48. Conversely, if XAU/USD stands above $1900, that could open the door to reclaiming September’s 20 high at $1947.39.
Author

Christian Borjon Valencia
FXStreet
Markets analyst, news editor, and trading instructor with over 14 years of experience across FX, commodities, US equity indices, and global macro markets.


