Gold Price Forecast: XAU/USD pivots around $1800, levels to watch – Confluence Detector
- Gold price cautious amid US yield curve flattening, month-end flows in play.
- Focus shifts to the US PCE inflation and FOMC decision fresh moves in gold.
- Gold price to maintain range play around $1800 ahead US PCE inflation.

With markets reassessing the Fed’s tightening expectations after the US Q3 GDP miss, gold price lacks impetus so far this Friday, pivoting around the $1800 level. The bond market rout extends, with the yield curve flattening in play, which helps put a floor under gold price. The bright metal now looks forward to the Fed’s preferred inflation gauge, the Core PCE index, for fresh trading impulse. Meanwhile, the month-end flows and pre-FOMC cautious trading could influence gold’s performance.
Gold Price: Key levels to watch
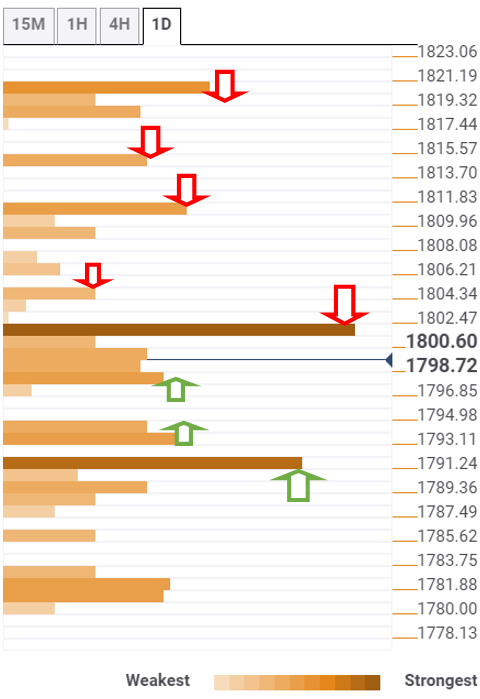
The Technical Confluences Detector shows that gold is trading listlessly below the powerful hurdle at $1802, where the previous high four-hour, Fibonacci 23.6% one-week and SMA5 four-hour converge.
Acceptance above the latter is critical to extending the previous gains towards the Fibonacci 23.6% one-day at $1804.
The next stop for gold bulls is envisioned at $1809, which is the confluence of the previous day’s high, pivot point one-day R1 and Bollinger Band one-day Upper.
The previous week’s high of $1814 will then grab the buyers’ attention.
Further up, the bulls will look to clear a bunch of resistance levels around $1820, which is the intersection of the pivot point one-day R2, pivot point one-month R1 and pivot point one-week R1.
Alternatively, the immediate decline could be capped at $1796, which is the meeting point of the previous low four-hour and SMA5 one-day.
The next significant support is seen at $1793, the convergence of the previous day’s low and SMA200 one-day.
Further south, the confluence of the Fibonacci 61.8% one-month and pivot point one-day S1 at $1791-$1790 will be the level to beat for gold bears.
Here is how it looks on the tool
About Technical Confluences Detector
The TCD (Technical Confluences Detector) is a tool to locate and point out those price levels where there is a congestion of indicators, moving averages, Fibonacci levels, Pivot Points, etc. If you are a short-term trader, you will find entry points for counter-trend strategies and hunt a few points at a time. If you are a medium-to-long-term trader, this tool will allow you to know in advance the price levels where a medium-to-long-term trend may stop and rest, where to unwind positions, or where to increase your position size.
Author

Dhwani Mehta
FXStreet
Residing in Mumbai (India), Dhwani is a Senior Analyst and Manager of the Asian session at FXStreet. She has over 10 years of experience in analyzing and covering the global financial markets, with specialization in Forex and commodities markets.

















