Gold Price Forecast: XAU/USD drops to one-month lows ahead of US data
- Gold remains pressured after reversing Tuesday’s gains, sidelined of late.
- Risk appetite sours amid anxiety over Fed’s next moves, covid and China news.
- US Retail Sales may help recede Fed tapering bets, favor gold buyers on matching down expectations for August.
- Gold Price Forecast: XAU/USD shows weakness, unable to hold above $1,800

Update: Gold continued losing ground through the mid-European session and dropped to one-month lows, around the $1,773-72 region in the last hour. The US dollar was back in demand amid expectations for an imminent Fed taper announcement and a modest pickup in the US Treasury bond yields. This, in turn, was seen as a key factor that weighed on the XAU/USD for the second successive day.
Meanwhile, the latest leg of a sudden fall over the past hour or so could be attributed to some technical selling below the $1,780 horizontal support, or monthly lows touched on Tuesday. Given the recent pullback from the $1,832-34 supply zone, the overnight rejection near a technically significant 200-day SMA and the subsequent decline supports prospects for additional losses.
Next on tap will be the US economic docket, highlighting the release of Retail Sales, Philly Fed Manufacturing Index and the usual Weekly Initial Jobless Claims. This, along with the US bond yields, might influence the USD price dynamics and provide some impetus to gold.
Previous update: Gold extended the previous day's rejection slide from the very important 200-day SMA and witnessed some follow-through selling for the second successive session on Thursday. The downward trajectory dragged the XAU/USD back closer to monthly swing lows, around the $1,780 region, touched earlier this week. Despite signs of easing inflationary pressures in the US, investors still believe that the Fed would begin rolling back its massive pandemic-era stimulus later this year. This, in turn, was seen as a key factor driving flows away from the non-yielding yellow metal.
Meanwhile, worries about the fast-spreading Delta variant and a global economic slowdown did little to lend any support to the safe-haven XAU/USD. Bulls even shrugged off a subdued US dollar price action, which tends to benefit dollar-denominated commodities, including gold. With the latest leg down, the precious metal has now erased its weekly gains and seems vulnerable to slide further. A convincing break below the $1,780 horizontal support will reaffirm the negative outlook and set the stage for the resumption of the recent decline from the $1,832-34 supply zone.
Previous update: Gold (XAU/USD) takes offers around $1,792.50, extending the previous day’s losses heading into Thursday’s European session.
The yellow metal failed to benefit from the US dollar weakness on Wednesday as market sentiment dwindles over the Fed’s next moves even as the US Consumer Price Index (CPI) favored equities and weighed on the US Treasury yields.
The reason could be linked to the cautious optimism shown by the European Central Bank (ECB) policymakers and strong NY Empire State Manufacturing, as well as Import-Export Price Index data for September and August respectively.
Among the ECB policymakers, Executive Board Member Isabel Schnabel was more hawkish while saying, “Market may be overestimating risks to the global growth outlook.” On the same line was ECB Chief Economist Philip Lane who said that he is happy that the accommodative monetary policy is helping to build core inflation in the euro area, as reported by Reuters.
It’s worth noting that Australia’s trilateral security pact with the UK and the US, availing nuclear-powered submarines, signals a further worsening of relations with China and weighed on market sentiment earlier in the day. Further, higher virus infections in Australia, China and New Zealand also challenge the risk appetite, as well as gold prices.
It should be noted that the US adds the UK to its welcome list for the next week’s diplomatic talks in the White House and amplifies market fears that the Western friends are again gearing up for a battle with China, which in turn heavy the sentiment.
Amid these plays, S&P 500 Futures erase early Asian gains while the US 10-year Treasury yields drop one basis point (bp) to retest 1.297% by the press time.
Given the market’s sour sentiment ahead of the key data, the risk catalysts could keep the gold prices pressured.
Read: US August Retail Sales Preview: Can gold turn bullish on a weak print?
Technical analysis
In addition to a pullback from a 17-day-old horizontal hurdle, gold traders’ failure to keeps 100-SMA breakout also hints at the commodity’s weakness, additionally portrayed by a downward sloping RSI line.
Hence, the gold sellers are well-directed towards the monthly support line, near $1,785.
However, a clear downside below the stated support line will set the tone for extra south-run to the mid-August lows near $1,770.
Meanwhile, 100-SMA and the horizontal area comprising multiple tops marked since August 24, respectively around $1,804 and $1,808-09, guard the metal’s short-term upside.
Also acting as the key resistance is a two-month-old area near $1,834 that holds the key to the gold upside towards the $1,900 threshold.
Overall, gold prices remain tight-lipped between short-term horizontal resistance and an ascending support line.
Gold: Four-hour chart
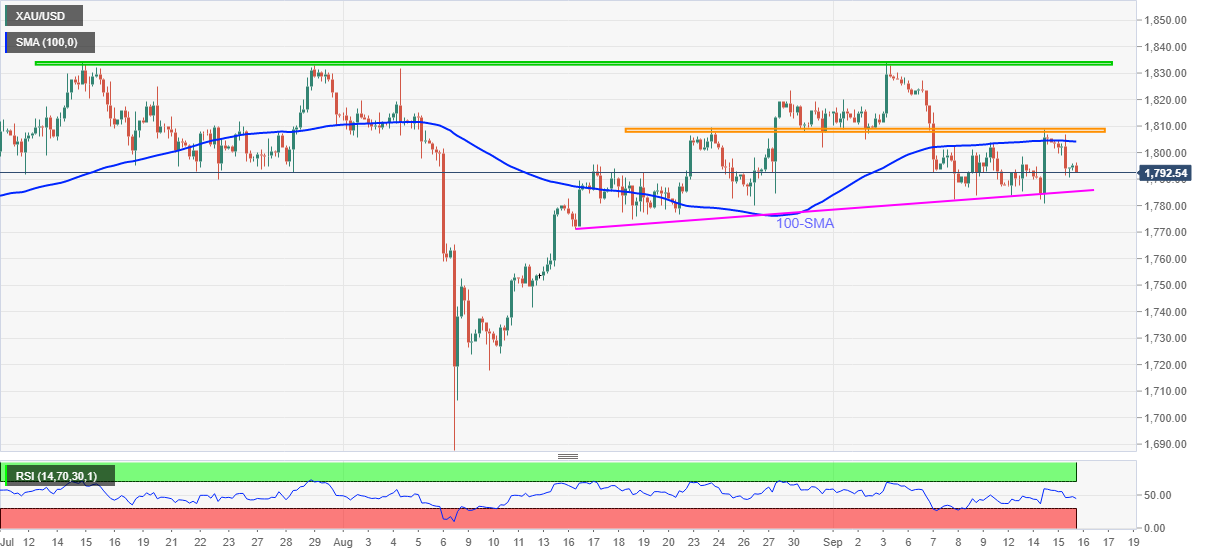
Trend: Further weakness expected
Author

Haresh Menghani
FXStreet
Haresh Menghani is a detail-oriented professional with 10+ years of extensive experience in analysing the global financial markets.


