|

Gold Price Forecast: XAU/USD juggles around $1,810 as focus shifts to Fed policy

  • Gold price is hovering around $1,810.00 as investors await Fed’s policy for fresh impetus.
  • S&P500 soared as a consecutive decline in US inflation faded recession fears.
  • The US Dollar Index (DXY) struggles to sustain above the 104.00 resistance as odds favor a smaller Fed rate hike.

Gold price (XAU/USD) is juggling around the immediate support of $1,810.00 in the Tokyo session. The precious metal has corrected after printing a fresh five-month high at $1,824.51 on Tuesday. Fresh blood was infused in Gold price after the release of a soft inflation report for November month.

The US Dollar Index (DXY) is struggling to sustain above the 104.00 resistance as a slowdown in inflationary pressures has cemented expectations of a smaller rate hike by the Fed. Fed policymakers were already advocating for a deceleration in the interest rate hike pace after the soft October inflation report. A consecutive significant slowdown in inflation has bolstered the chances of adopting a less-hawkish approach toward the monetary policy.

The risk-appetite theme after a decline in price pressures strengthened S&P500. Futures of the 500-US stock basket are expected to accelerate further as recession fears have faded to a greater extent. Also, the 10-year US Treasury yields have dropped to nearly 3.50%.

A note from Commerzbank dictates that “The 50 basis points hike, which is generally expected for tomorrow's FOMC meeting, can be considered almost certain after today's data.” We continue to assume that the Fed will reduce the size of the rate hikes again at the beginning of 2023, moving by only 25 bps in February and March.

Gold technical analysis

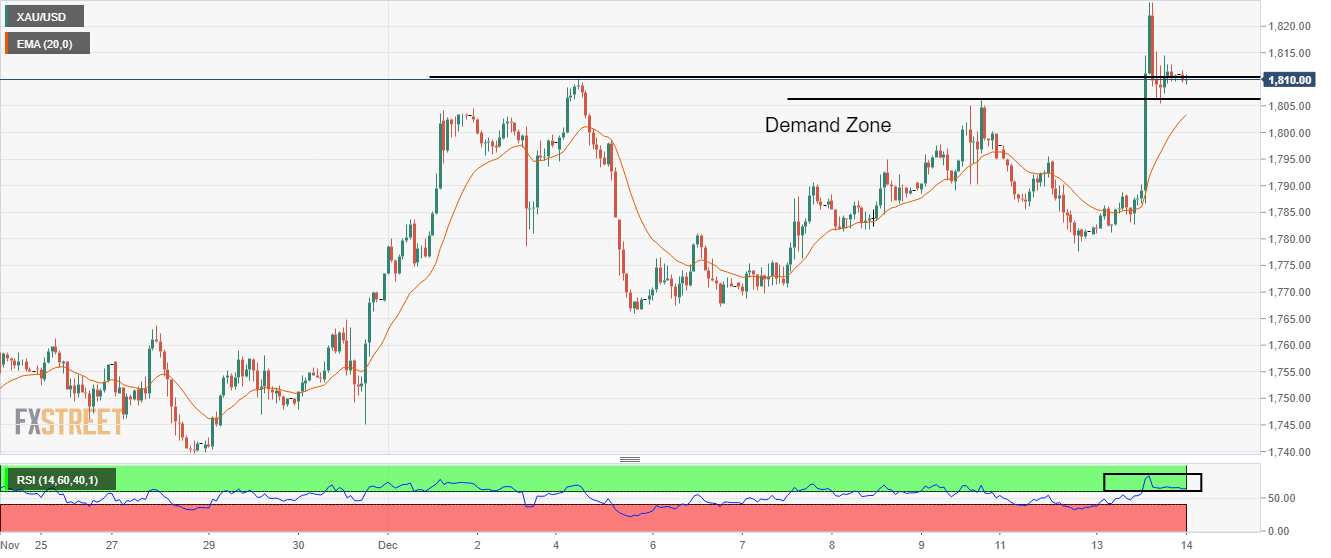
On an hourly scale, the Gold price has corrected to near the demand zone in a narrow range of $1,806-1,810. The 20-period Exponential Moving Average (EMA) at $1803.60 will act as a major cushion for Gold price. Meanwhile, the Relative Strength Index (RSI) (14) has shifted into the bullish range of 60.00-80.00, which indicates that the bullish momentum is active.

Gold hourly chart
XAU/USD

Overview
Today last price1811.27
Today Daily Change0.79
Today Daily Change %0.04
Today daily open1810.48
 
Trends
Daily SMA201769.32
Daily SMA501714.31
Daily SMA1001719.53
Daily SMA2001790.39
 
Levels
Previous Daily High1824.55
Previous Daily Low1780.06
Previous Weekly High1810.12
Previous Weekly Low1765.89
Previous Monthly High1786.55
Previous Monthly Low1616.69
Daily Fibonacci 38.2%1807.55
Daily Fibonacci 61.8%1797.06
Daily Pivot Point S11785.51
Daily Pivot Point S21760.54
Daily Pivot Point S31741.02
Daily Pivot Point R11830
Daily Pivot Point R21849.52
Daily Pivot Point R31874.49

Author

Sagar Dua

Sagar Dua

FXStreet

Sagar Dua is associated with the financial markets from his college days. Along with pursuing post-graduation in Commerce in 2014, he started his markets training with chart analysis.


More from Sagar Dua
Share:

Editor's Picks

GBP/USD treads water just below 1.3300

GBP/USD alternates gains with losses just below 1.3300 the figure on Tuesday. Indeed, Cable struggles to build recovery momentum as the Greenback benefits from a cautious market mood ahead of the Fed’s meeting on Wednesday and the BoE’s gathering on Thursday.

EUR/USD turns positive past 1.1370

EUR/USD rebounds from earlier multi-week lows and flirts with the 1.1380 zone, up marginally for the day on Tuesday. Uncertainty surrounding the US-Iran conflict weighs on risk sentiment and caps the pair’s upside, while investors avoid taking large positions ahead of the highly anticipated Fed meeting on Wednesday.

Gold closes in on $4,000 ahead of FOMC decision

Gold (XAU/USD) maintains its offered on Tuesday and declines toward the $4,000 psychological level. This follows the previous day's failure to find acceptance above the $4,100 mark and suggests that the path of least resistance for the bullion remains to the downside amid a bullish US Dollar (USD), which draws support from escalating geopolitical tensions ahead of the cricital FOMC meeting.

Bitcoin slips below $64,000 as risk-off sentiment grips markets
Bitcoin (BTC) is extending its correction, trading below $64,000 at the time of writing on Tuesday after losses of over 2.5% the previous day. Institutional demand shows early signs of weakness, with spot Exchange Traded Funds (ETFs) recording a mild outflow on Monday, marking three consecutive days of withdrawals.
Indian Rupee outlook: Downtrend set to persist – Just at a slower pace
The Indian Rupee just endured its most brutal six-month stretch in years, battered by a perfect storm of global shocks. From United States (US)-India trade uncertainty to surging Oil prices and the significant outflow of Foreign Institutional Investment (FII) from the Indian stock market, every event brought nothing but pain for the Indian currency.
US Dollar mid-year outlook: Exceptional currency, exceptional risks?
The US Dollar enters the second half of 2026 in a markedly different position from a year ago. The King currency has recovered, reflecting persistent US inflation, changing expectations for Fed policy, geopolitical tensions and renewed demand for defensive assets.