Gold Price Forecast: XAU/USD steadies below $1,850 amid risk aversion, pre-Fed anxiety


Update: Gold (XAU/USD) prices remain pressured around intraday low surrounding $1,836, mostly inactive during early Friday.

The yellow metal struggles for a clear direction after stepping back from the key resistance line the previous day. In doing so, the gold stays divided between the hawkish Fed expectations and the downbeat US Treasury yields, as well as the US Dollar Index (DXY).

That said, the greenback gauge drops 0.06% intraday while the US 10-year Treasury yields decline for the third consecutive day to recently around 1.77%, down 5.5 basis points (bps). Also portraying the risk-off mood is the 0.6% intraday loss of the S&P 500 Futures and downbeat performance of Asia-Pacific equities.

It’s worth observing that a lack of major data/events join the metal’s pullback to cross the key resistance may trigger the quote’s pullback move amid cautious sentiment ahead of the next week’s Federal Open Market Committee (FOMC).

End of update.


Gold (XAU/USD) extends late  Thursday’s pullback from a two-month high, refreshes intraday low around $1,838 during Friday’s Asian session. In doing so, the yellow metal bears the burden of the risk-off mood even as the US Treasury yields stay on the back foot.

The metal’s pullback from the year-long resistance line could be linked to the market’s fears over the US Federal Reserve’s (Fed) next moves amid recently mixed data and the policymaker’s readiness to act.

That said, the US Jobless Claims jumped to the highest since late October and the Philadelphia Fed Manufacturing Survey details also improved for January. However, US Treasury Secretary Yellen recently said in the CNBC interview, “Inflation rose by more than most economists, including me, expected and of course, it's our responsibility with the Fed to address that. And we will.”

While portraying the mood, the US 10-year Treasury yields posted a second consecutive daily loss, down four basis points to 1.79% at the latest, whereas the S&P 500 Future dropped 0.30% intraday by the press time.

It’s worth observing that news from the South China Morning Post (SCMP) relating to the Sino-American ties should have helped the market sentiment but did not. SCMP signaled that China’s Yang Jiechi and US national security adviser Jake Sullivan are up for a crunch meeting but no date was indicated.

The yellow metal poked one-year-old resistance line as the US dollar tracked Treasury yields. However, the recent pre-Fed caution seems to weigh on gold prices, which in turn may continue amid a lack of major data/events and the metal’s failure to cross the key hurdle to the north.

Technical analysis

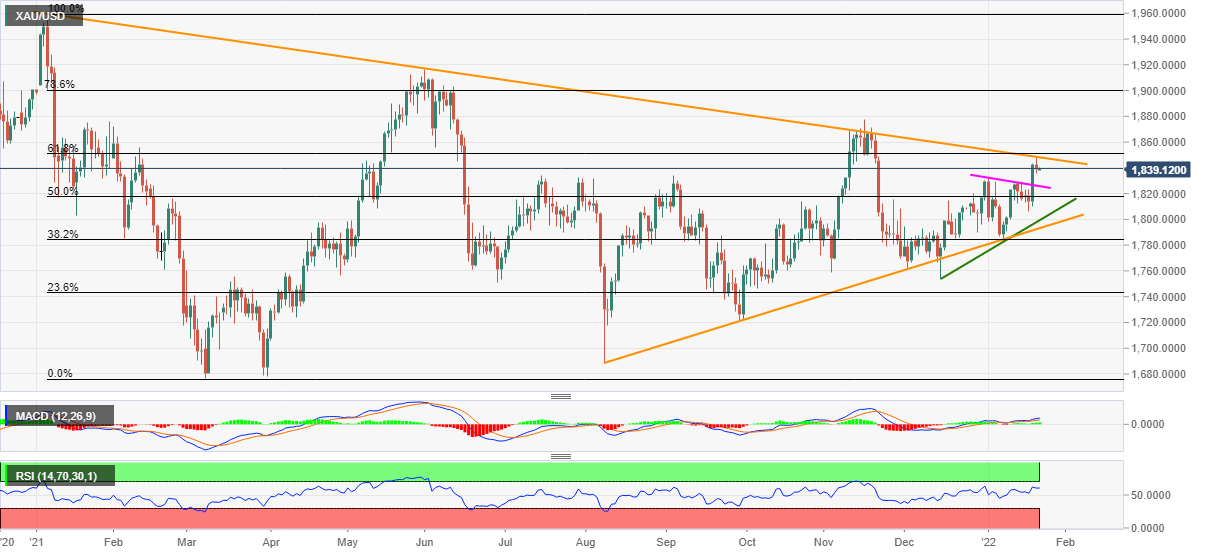
Having crossed a three-week-old resistance line on Wednesday, now support around $1,826, gold retreats from a year-long downward sloping trend line, around $1,850, amid firmer RSI and bullish MACD signals.

Though, $1,850 isn’t the only key to open the door for gold buyers as 61.8% Fibonacci retracement (Fibo.) of January-March 2021 fall, near $1,852, acts as a validation point to the rally targeting late 2021 peak of $1,877.

Following that, the 78.6% Fibo. level surrounding $1,900 and June 2021 peak of $1,916-17 will be in focus.

Alternatively, pullback moves below $1,826 will drag the quote towards the $1,800 threshold but an ascending support line from mid-December, close to $1,798, will test the gold sellers afterward.

Even if the gold prices fall below $1,798, a five-month-old support line close to $1,791-92 will be crucial as a clear break of which won’t hesitate to welcome gold bears.

To sum up, gold buyers approach key resistance that could give buyers a free hand.

Gold: Daily chart

Trend: Further upside expected

Additional important levels

Overview
Today last price 1838.46
Today Daily Change -4.12
Today Daily Change % -0.22%
Today daily open 1842.58
 
Trends
Daily SMA20 1813.17
Daily SMA50 1806.96
Daily SMA100 1794.21
Daily SMA200 1804.06
 
Levels
Previous Daily High 1843.35
Previous Daily Low 1810.32
Previous Weekly High 1829.23
Previous Weekly Low 1790.43
Previous Monthly High 1830.39
Previous Monthly Low 1753.01
Daily Fibonacci 38.2% 1830.73
Daily Fibonacci 61.8% 1822.94
Daily Pivot Point S1 1820.82
Daily Pivot Point S2 1799.05
Daily Pivot Point S3 1787.79
Daily Pivot Point R1 1853.85
Daily Pivot Point R2 1865.11
Daily Pivot Point R3 1886.88


Share: Feed news

Information on these pages contains forward-looking statements that involve risks and uncertainties. Markets and instruments profiled on this page are for informational purposes only and should not in any way come across as a recommendation to buy or sell in these assets. You should do your own thorough research before making any investment decisions. FXStreet does not in any way guarantee that this information is free from mistakes, errors, or material misstatements. It also does not guarantee that this information is of a timely nature. Investing in Open Markets involves a great deal of risk, including the loss of all or a portion of your investment, as well as emotional distress. All risks, losses and costs associated with investing, including total loss of principal, are your responsibility. The views and opinions expressed in this article are those of the authors and do not necessarily reflect the official policy or position of FXStreet nor its advertisers. The author will not be held responsible for information that is found at the end of links posted on this page.

If not otherwise explicitly mentioned in the body of the article, at the time of writing, the author has no position in any stock mentioned in this article and no business relationship with any company mentioned. The author has not received compensation for writing this article, other than from FXStreet.

FXStreet and the author do not provide personalized recommendations. The author makes no representations as to the accuracy, completeness, or suitability of this information. FXStreet and the author will not be liable for any errors, omissions or any losses, injuries or damages arising from this information and its display or use. Errors and omissions excepted.

The author and FXStreet are not registered investment advisors and nothing in this article is intended to be investment advice.

Recommended content


Recommended content

Editors’ Picks

EUR/USD: The first upside target is seen at the 1.0710–1.0715 region

EUR/USD: The first upside target is seen at the 1.0710–1.0715 region

The EUR/USD pair trades in positive territory for the fourth consecutive day near 1.0705 on Wednesday during the early European trading hours. The recovery of the major pair is bolstered by the downbeat US April PMI data, which weighs on the Greenback. 

EUR/USD News

GBP/USD rises to near 1.2450 despite the bearish sentiment

GBP/USD rises to near 1.2450 despite the bearish sentiment

GBP/USD has been on the rise for the second consecutive day, trading around 1.2450 in Asian trading on Wednesday. However, the pair is still below the pullback resistance at 1.2518, which coincides with the lower boundary of the descending triangle at 1.2510.

GBP/USD News

Gold price struggles to lure buyers amid positive risk tone, reduced Fed rate cut bets

Gold price struggles to lure buyers amid positive risk tone, reduced Fed rate cut bets

Gold price lacks follow-through buying and is influenced by a combination of diverging forces. Easing geopolitical tensions continue to undermine demand for the safe-haven precious metal. Tuesday’s dismal US PMIs weigh on the USD and lend support ahead of the key US data.

Gold News

Crypto community reacts as BRICS considers launching stablecoin for international trade settlement

Crypto community reacts as BRICS considers launching stablecoin for international trade settlement

BRICS is intensifying efforts to reduce its reliance on the US dollar after plans for its stablecoin effort surfaced online on Tuesday. Most people expect the stablecoin to be backed by gold, considering BRICS nations have been accumulating large holdings of the commodity.

Read more

US versus the Eurozone: Inflation divergence causes monetary desynchronization

US versus the Eurozone: Inflation divergence causes monetary desynchronization

Historically there is a very close correlation between changes in US Treasury yields and German Bund yields. This is relevant at the current juncture, considering that the recent hawkish twist in the tone of the Fed might continue to push US long-term interest rates higher and put upward pressure on bond yields in the Eurozone.

Read more

Forex MAJORS

Cryptocurrencies

Signatures