Gold Price Forecast: XAU/USD hovers around $1,800 with eyes on India, Fed
- Gold struggles to extend week-start rebound, eases from intraday top.
- Festive demand at the world’s largest gold customer eyed, Fed’s verdict important too.
- US Treasury yields print three-day downtrend but the US dollar remains indecisive.
- Gold Price Forecast: XAU/USD awaits acceptance above this key hurdle, as Fed meet kicks off

Gold (XAU/USD) remains lackluster below $1,800, easing to $1,793 ahead of Tuesday’s European session.
In doing so, the yellow metal lacks momentum strength to stretch the previous day’s rebound amid the traders’ indecision before US Federal Reserve (Fed) meeting, up for Wednesday.
Also keeping the gold prices challenged is the ongoing festive season in India, the world’s biggest bullion buyer, in contrast to economic hardships in another major gold buyer namely China. Given the recent improvement in Indian fundamentals and the Reserve Bank of India’s (RBI) refrain from monetary policy tightening, New Delhi’s gold demand may recover from the previous year’s disappointment. “India's gold demand could strengthen significantly in the fourth quarter (Q4),” per the World Gold Council’s (WGC) latest report cited by Reuters.
Elsewhere, China’s Ministry of Commerce urged the authorities to have a good stock of food ahead of winter, raising fears amid the power-cut problems and Evergrande-led economic woes.
Elsewhere, the US Dollar Index (DXY) remains sidelined but the US 10-year Treasury yields drop for the third consecutive day as inflation expectations ease before the Fed. Also challenging the Fed hawks are the latest mixed US PMIs for October.
It’s worth noting that the equities remain mildly offered and support the rush to risk-safety ahead but a light calendar and the pre-Fed trading lull challenge gold buyers.
Technical analysis
Gold remains supported by a two-day-old ascending trend line and 200-EMA amid a firmer RSI line. The same hints at the quote’s further advances towards a weekly resistance line near the $1,800 threshold.
However, any further upside will have multiple hurdle around $1,810 and October’s peak near $1,813 before directing the bulls towards the key $1,834 resistance level, comprising tops marked during July and September.
On the contrary, a clear downside break of 200-EMA level surrounding $1,789 should recall the gold sellers targeting Friday’s bottom surrounding $1,772.
In a case where the gold bears keep reins past $1,772, the late October’s swing low near $1,760 should return to the charts.
Gold: Hourly chart
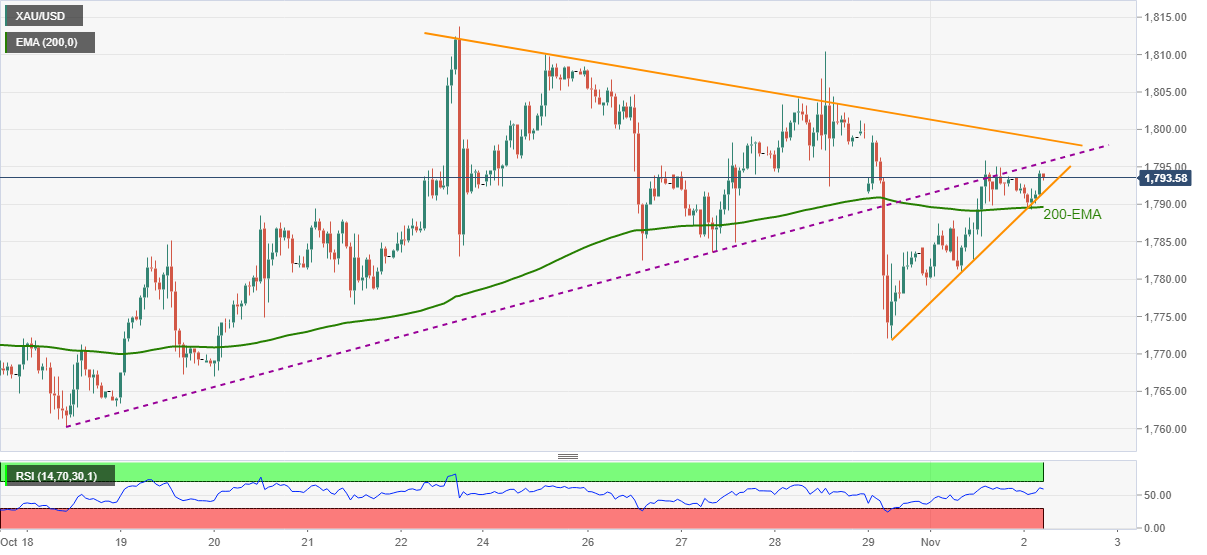
Trend: Pullback expected
Author

Anil Panchal
FXStreet
Anil Panchal has nearly 15 years of experience in tracking financial markets. With a keen interest in macroeconomics, Anil aptly tracks global news/updates and stays well-informed about the global financial moves and their implications.