Gold Price Forecast: XAU/USD grinds higher, United States Consumer Confidence, Treasury bond yields eyed
- Gold price seesaws around weekly top after rising the most in three weeks.
- United States Treasury bond yields underpinned US Dollar’s biggest daily fall in a week and propelled XAU/USD.
- Gold buyers also cheered receding fears of recession, hopes for more stimulus from China.
- US data, risk catalysts will be crucial as Gold traders approach the key resistance near $1,820.

Gold price (XAU/USD) remains sidelined around $1,820 as the metal buyers take a breather during early Wednesday, following the biggest daily jump in three weeks. That said, the US Dollar’s weakness and receding fears of the economic slowdown, as per the Treasury bond yields curve inversion, seemed to have favored the XAU/USD bulls previously. However, the cautious mood ahead of the key United States data and technical analysis challenges the bullion buyers of late.
Gold buyers cheer softer US Dollar
Gold price rallied heavily the previous day as the US Dollar Index (DXY), a gauge of the US Dollar’s move versus the major six currencies, dropped the most in a week, down 0.67% intraday to 103.95 while marking a two-day downtrend. In doing so, the DXY traders feared less Japanese bond-buying of the United States Treasury bonds due to the latest Bank of Japan (BOJ) action. It’s worth noting that Japan is the biggest holder of the US Treasury bonds and the latest move allows Tokyo to put more funds into the nation than letting them flow outside.
Bank of Japan (BOJ) rocked markets the previous day and fuelled the Gold price with a surprise move that suggests lesser funds flowing outside Japanese bond markets due to a policy tweak. The Japanese central bank kept the monetary policy unchanged but widened the band of Yield Curve Control (YCC) to -/+ 0.5% from -/+0.25% prior.
United States Treasury bond yields favored XAU/USD bulls, via recession signals
It’s worth noting that the Bank of Japan’s moves triggered the United States bond market signals that suggested receding bets on the economic slowdown, which in turn allowed the Gold buyers to keep the reins. That said, the 10-year counterpart rose more than the two-year ones and hence reduced the yield curve inversion that suggests the market’s fears of recession. It should be noted that the US 10-year Treasury yields grind near a three-week high of 3.69% while the two-year bond coupons stay firmer around 4.26% by the press time.
China-linked headlines also welcome Gold buyers
Being one of the largest customers of Gold, headlines suggesting more stimulus from China, mainly due to the downbeat economic forecasts from the World Bank and policymakers’ readiness to defend the economy, propelled XAU/USD prices the previous day. It’s worth noting, however, that recently softer China economics and mixed concerns surrounding Covid challenge Gold buyers.
US data, yields in focus
Having witnessed a solid run-up, Gold buyers seem to take a breather after the United States Conference Board (CB) Consumer Confidence figures for December, expected 101.00 versus 100.00 prior. Also likely to have probed the XAU/USD bulls could be the latest inaction in the bond markets, after a volatile day, as well as technical space that probes the Gold’s further upside. Should the scheduled US data manage to print higher numbers, the US Dollar may witness a recovery and hence the Gold price could retreat.
Gold price technical analysis
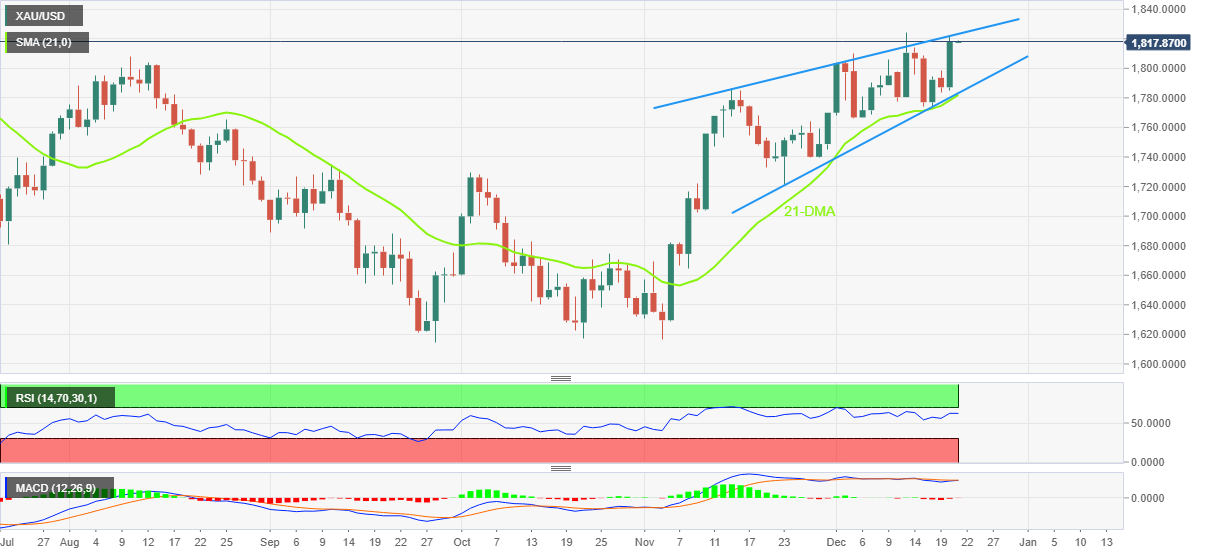
With the heaviest daily rise since December’s start, Gold price approaches the upper line of a five-week-long rising wedge bearish chart pattern, around $1,823 by the press time.
It’s worth noting, however, that the Relative Strength Index (RSI), located at 14, suggests the commodity’s limited upside by being near the overbought region. On the same line, sluggish signals from the Moving Average Convergence and Divergence (MACD) indicator challenge Gold’s further advances.
Hence, the XAU/USD’s upside appears capped near $1,825, at least for now.
However, Gold’s clear break of the said resistance would defy the bearish chart pattern and can quickly propel the precious metal toward June’s high near $1,880.
On the contrary, a convergence of the 21-DMA and the stated wedge’s lower line offers a tough nut to crack for the Gold bears, around $1,780. That said, the $1,800 round figure could restrict the short-term downside of the Gold price.
Gold price: Daily chart
Trend: Limited upside expected
Author

Anil Panchal
FXStreet
Anil Panchal has nearly 15 years of experience in tracking financial markets. With a keen interest in macroeconomics, Anil aptly tracks global news/updates and stays well-informed about the global financial moves and their implications.