|

Gold Price Forecast: XAU/USD falls back below $1,920 as Fed remains hawkish on interest rate guidance

  • Gold price has failed to sustain above $1,920.00 amid a hawkish interest rate outlook from the Fed.
  • Fed policymakers are in support of more restricting monetary policy as inflation is still stubborn due to robust demand.
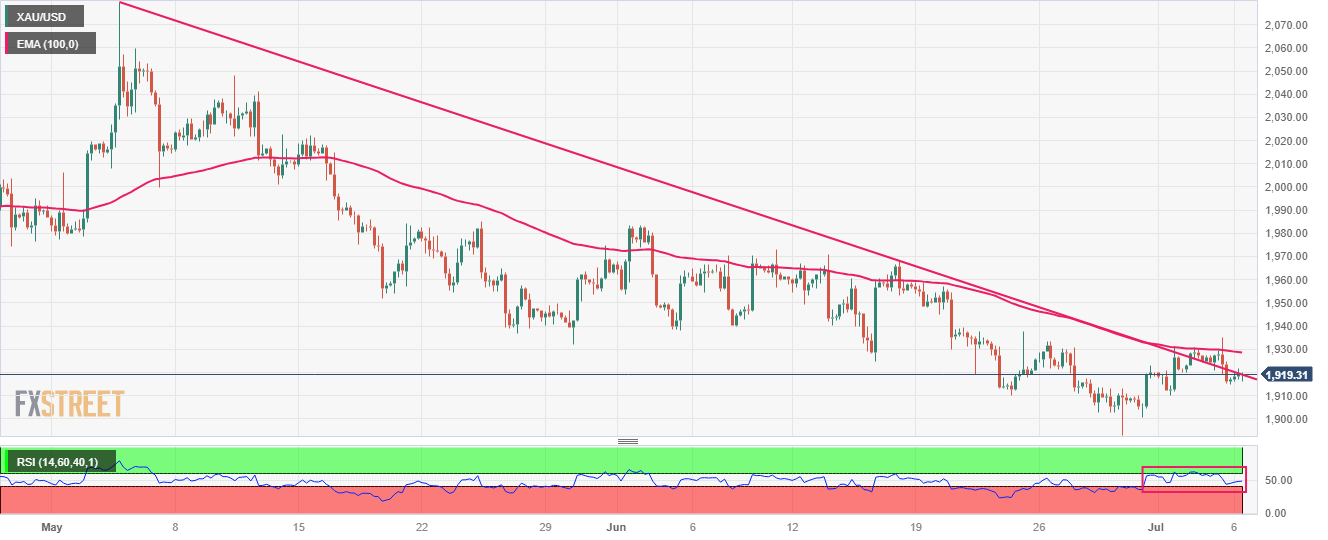
  • Gold price has faced severe selling pressure while attempting to surpass the 100-period EMA plotted around $1,929.00.

Gold price (XAU/USD) has sensed selling pressure while attempting to sustain above the crucial resistance of $1,920.00 in the European session. The precious metal is struggling to attract bets as Federal Reserve (Fed) policymakers remained hawkish on interest rate outlook, according to Federal Open Market Committee (FOMC) minutes.

Despite deepening worries about the economic outlook due to tight credit conditions, Fed policymakers are in support of more restricting monetary policy as inflation is still stubborn due to robust demand.

S&P500 futures have posted meaningful losses in Europe as investors are cautious ahead of Employment data and quarterly result season. On Thursday, investors will focus on the Automatic Data Processing (ADP) Employment Change report. As per the estimates, the US ADP report will show fresh additions of 228K in June vs. the former addition of 278K.

In addition to the ADP Employment report, US ISM Services PMI will also be on the radar. The economic data is seen higher at 51.0 vs. the former release of 50.3. While New Orders Index is seen declining to 53.3 against the prior release of 56.2.

Meanwhile, the US Dollar Index (DXY) is expected to turn sideways as investors have sidelined ahead of key economic indicators. However, the 10-year US Treasury yields have climbed to 3.97%.

Gold technical analysis

Gold price has faced severe selling pressure while attempting to surpass the 100-period Exponential Moving Average (EMA) plotted around $1,929.00. The precious metal failed to sustain above the downward-sloping trendline plotted from May 03 high at $2,079.76.

The Relative Strength Index (RSI) (14) is oscillating in the 40.00-60.00. Bearish momentum would trigger if it drops below 40.00.

Gold four-hour chart

XAU/USD

Overview
Today last price1919.2
Today Daily Change3.79
Today Daily Change %0.20
Today daily open1915.41
 
Trends
Daily SMA201933.75
Daily SMA501964.83
Daily SMA1001946.38
Daily SMA2001863.76
 
Levels
Previous Daily High1935.09
Previous Daily Low1914.84
Previous Weekly High1933.39
Previous Weekly Low1893.01
Previous Monthly High1983.5
Previous Monthly Low1893.01
Daily Fibonacci 38.2%1922.58
Daily Fibonacci 61.8%1927.35
Daily Pivot Point S11908.47
Daily Pivot Point S21901.53
Daily Pivot Point S31888.22
Daily Pivot Point R11928.72
Daily Pivot Point R21942.03
Daily Pivot Point R31948.97

Author

Sagar Dua

Sagar Dua

FXStreet

Sagar Dua is associated with the financial markets from his college days. Along with pursuing post-graduation in Commerce in 2014, he started his markets training with chart analysis.

More from Sagar Dua
Share:

Editor's Picks

GBP/USD bounces off lows, back above 1.3200

After bottoming out near 1.3160, GBP/USD manages to regain a bit of shine and reclaim the 1.3200 mark and beyond at the end of the week. Stronger-than-expected UK Retail Sales data seem to be helping the British Pound limit its losses, while the chaotic UK political environment keeps the bulls at bay for now.

EUR/USD looks consolidative around 1.1460

EUR/USD stages a modest rebound after slipping to a three-month low below 1.1420 at the end of the week. That said, the pair now looks to consolidate humble gains just above 1.1460 despite growing uncertainty surrounding the next round of US-Iran negotiations, which keeps the US Dollar’s downside contained.

Gold slips back to six-day lows, targets $4,100

Gold retreats for the third consecutive day on Friday, eroding gains seen in the first half of the week and approaching the key $4,100 mark per troy ounce. Indeed, the precious metal continues to face headwinds from the Fed's hawkish stance and renewed uncertainty surrounding the next round of US-Iran negotiations.

Solana extends correction despite ETF inflows, RWA adoption

Solana (SOL) price edges below $70 extending its losses for the fourth straight day this week. The institutional demand for Solana is building, with steady inflows so far this week and Morgan Stanley’s amended S-1 filing for a Solana-focused Exchange-Traded Fund.

The Iran war didn't break the US economy, but what happens next?

Nearly four months after the start of the Iran war, the US economy remains remarkably resilient. While the conflict initially triggered a severe disruption to global energy markets and a sharp rise in Oil prices, recent diplomatic progress between Washington and Tehran has eased concerns about a prolonged supply shock.

Regime change: Inside Kevin Warsh's first move to make the Fed unreadable on purpose

The rate did not move. That was the least interesting thing about Kevin Warsh's first meeting in charge of the Fed. The FOMC held its benchmark at 3.50%-3.75% for the fourth straight meeting, exactly as priced, and then the new chair used his first press conference to dismantle the machinery the market has leaned on for a decade.