Gold Price Forecast: XAU/USD faces a wall of resistances around $1765 – Confluence Detector
- Gold price rebounds from critical $1750 amid mixed market sentiment.
- Rising energy costs, inflation lift gold’s appeal but firmer yields warrant caution.
- Gold on the back foot as NFP fails to alter taper prospects.

Gold is attempting another run higher on Monday, despite the risk-on market mood and persistent strength in the US Treasury yields, which underpins the greenback. Soaring energy prices combined with rising inflation expectations continue to back the case for the Fed’s monetary policy normalization, even though Friday’s US Nonfarm Payrolls disappointed.
The renewed uptick in gold could be associated with higher inflation expectations, as the bright metal is seen as a hedge against inflation. Further, fresh US-China spat over Taiwan and the phase one trade deal is helping put a floor under gold price. It’s worth adding that the US markets are closed in observance of Columbus Day and therefore, light trading conditions could exaggerate the moves in gold price.
Read: Gold, Chart of the Week: XAU/USD bulls are stepping in
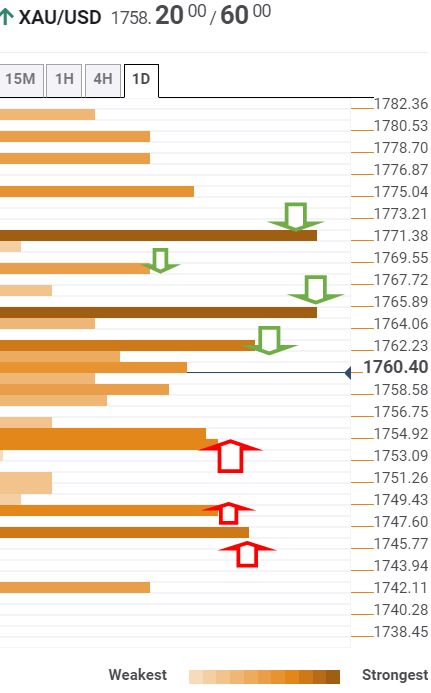
Gold Price: Key levels to watch
According to the Technical Confluences Detector, gold is running into a dense cluster of healthy resistance levels around $1761, which is the convergence of the Bollinger Band one-day Middle, SM5 one-day and Fibonacci 38.2% one-week.
A firm break above that supply zone is needed to challenge the next significant upside barrier at $1765, where the Fibonacci 61.8% one-day coincides with the Fibonacci 38.2% one-month.
Further up, the buyers will look out for the Fibonacci 61.8% one-week at $1767, above which the Fibonacci 38.2% one-day at $1771 will be the level to beat for gold bulls.
On the flip side, gold bulls will find fierce support at $1754, the convergence of the SMA50 four-hour, Fibonacci 23.6% one-week and the previous day’s low.
Acceptance below the latter could call for a test of the $1748 level, which is the Fibonacci 23.6% one-month.
The last line of defense for gold buyers is seen at $1746, the intersection of the previous week’s low and pivot point one-day S1.
Here is how it looks on the tool
About Technical Confluences Detector
The TCD (Technical Confluences Detector) is a tool to locate and point out those price levels where there is a congestion of indicators, moving averages, Fibonacci levels, Pivot Points, etc. If you are a short-term trader, you will find entry points for counter-trend strategies and hunt a few points at a time. If you are a medium-to-long-term trader, this tool will allow you to know in advance the price levels where a medium-to-long-term trend may stop and rest, where to unwind positions, or where to increase your position size.
Author

Dhwani Mehta
FXStreet
Residing in Mumbai (India), Dhwani is a Senior Analyst and Manager of the Asian session at FXStreet. She has over 10 years of experience in analyzing and covering the global financial markets, with specialization in Forex and commodities markets.


