Gold Price Forecast: XAU/USD weakens further below $1,800 mark, dives to 1-1/2 month lows

Update: Gold witnessed another downswing during the early North American session and dropped to $1,775 region, or the lowest level since May 5 in the last hour. The US dollar built on the post-FOMC strong positive move and shot to over two-month tops on Thursday. This, in turn, was seen as a key factor that acted as a headwind for dollar-denominated commodities, including gold.
It is worth recalling that the Fed on Wednesday stunned investors and brought forward its projections for the first post-pandemic interest rate hikes into 2023. The Fed also indicated that it will soon work on tapering down the current $120 billion in monthly bond purchases, which further contributed to driving flows away from the non-yielding yellow metal.
Apart from this, the downfall could further be attributed to some technical selling below the $1,800 round-figure mark. This comes on the back of the overnight sustained break below the very important 200-day SMA and sets the stage for additional weakness. That said, extremely oversold conditions might help limit any further losses for gold, at least for now.
Apart from this, a generally softer tone surrounding the equity markets and a modest pullback in the US Treasury bond yields might hold traders from placing any aggressive bets around gold. Nevertheless, the bias remains tilted in favour of bearish traders and supports prospects for a slide towards testing the next relevant support near the $1,760-58 region.
Previous update: Gold price snapped its recovery mode and resumed its downtrend, now flirting with fresh monthly lows just above $1800. Resurgent supply in the European session prompted another downswing for gold price, as the dead cat bounce witnessed earlier in the Asian trades vanished.
The European traders hit their desks and reacted to Wednesday’s US Federal Reserve’s (Fed) hawkish surprise, fuelling a fresh leg up in the US dollar across the board. The Fed hinted a sooner-than-expected rate hike while keeping tapering expectations alive. The US dollar index jumped from 91.33 to 91.76 after the Asian consolidation, hitting fresh two-month highs. However, the US Treasury yields remain on the defensive, although hold onto the post-FOMC rally, keeping the bearish pressures intact on gold price.
The Fed-induced blow on gold price is likely to have a lasting impact, as attention now turns towards the US weekly Jobless Claims data for fresh trading impetus.
Read: Gold Price Forecast: ‘Buy the dips’ rescues XAU/USD after the Fed-blow, but for how long?
Gold Price: Key levels to watch
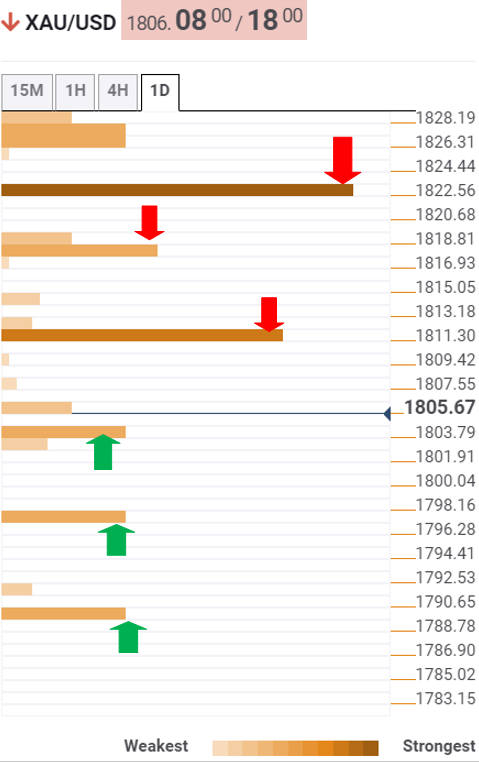
The Technical Confluences Detector shows that gold price is challenging the critical support around $1802, the convergence of the previous day low and Bollinger Band 15-minutes Lower.
Sellers remain poised to test the key SMA100 one-day at $1797 is the latter caves in.
The next downside target is aligned at the pivot point one-day S1 of $1789.
However, if the $1800 round number holds up, a bounce-back towards $1810 could be in the offing. That level is the pivot point one-month S1.
Gold bulls will then flex their muscles to probe $1817, the intersection of the SMA10 one-hour and Fibonacci 23.6% one-day.
Recapturing $1822 is critical to negate the bearish momentum in the near term. The powerful resistance is the confluence of the Fibonacci 61.8% one-month and the previous high four-hour.
Here is how it looks on the tool
About Technical Confluences Detector
The TCD (Technical Confluences Detector) is a tool to locate and point out those price levels where there is a congestion of indicators, moving averages, Fibonacci levels, Pivot Points, etc. If you are a short-term trader, you will find entry points for counter-trend strategies and hunt a few points at a time. If you are a medium-to-long-term trader, this tool will allow you to know in advance the price levels where a medium-to-long-term trend may stop and rest, where to unwind positions, or where to increase your position size.
Author

Dhwani Mehta
FXStreet
Residing in Mumbai (India), Dhwani is a Senior Analyst and Manager of the Asian session at FXStreet. She has over 10 years of experience in analyzing and covering the global financial markets, with specialization in Forex and commodities markets.


