Gold Price Forecast: XAU/USD eyes $1,700 as path of least resistance appears down – Confluence Detector
- Gold price reverses sharply amid an upturn in the yields and the US dollar.
- Global tightening bets, recession fears continue to bode ill for the bullion.
- XAU/USD eyes the $1,700 mark amid a bear cross and a wall of resistance levels.

Gold price is looking to resume the recent downtrend, as sellers fight back control ahead of key US events and the ECB rate hike decision. The European energy crisis-led recession fears keep investors on the edge while driving yields higher globally. The benchmark US 10-year Treasury yields are roughly 2% higher on the day at around 3.25%, emerging as the main catalyst behind the dollar recovery and the renewed downside in the non-yielding bullion. The bright metal also remains weighed down by hopes for continued tightening by major global central banks, as they remain committed in their fight to tame inflation. Further, a looming bear cross on the metal’s daily chart also keeps the downside favored for sellers. All eyes now remain on the US ISM Services PMI, ECB policy announcement and Fed Chair Jerome Powell’s speech for fresh trading impetus.
Also read: Gold Price Forecast: Will XAU/USD find acceptance above 23.6% Fibo resistance?
Gold Price: Key levels to watch
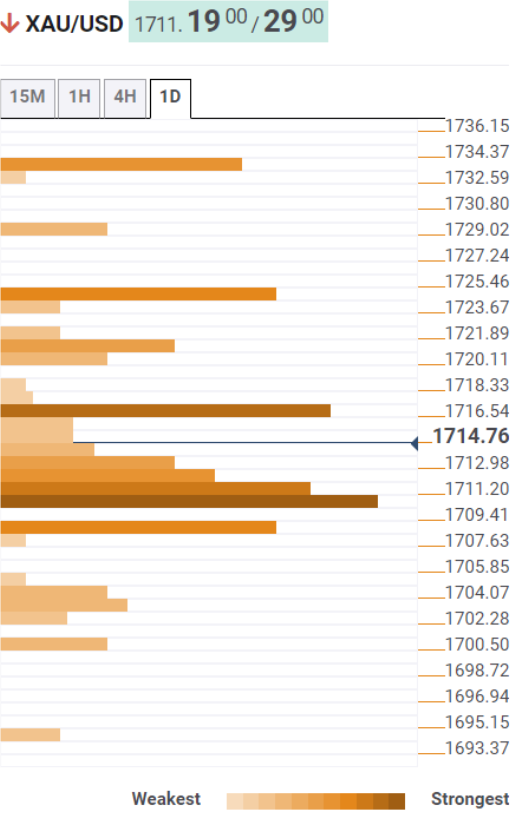
The Technical Confluence Detector shows that the gold price is challenging powerful support at around $1,711, which is the convergence of the previous month’s low and Fibonacci 23.6% one-day.
A sustained break below the latter will put the previous day’s low of $1,709 under threat. The next support zone is seen around $1,703, where the Fibonacci 23.6% one-week and pivot point one-day S2 merge.
Sellers will then test the $1,700 mark, the round figure and the pivot point one-day S3.
On the flip side, a dense cluster of healthy resistance levels is stacked up around $1,713, the intersection of the SMA10 four-hour, Fibonacci 61.8% one-day and the SMA5 one-day.
The previous day’s high of $1,716 will offer further resistance to bulls on their road to recovery. The next relevant upside target is aligned at the Fibonacci 161.8% one-day at $1,720.
The confluence of the Fibonacci 61.8% one-week and pivot point one-day R3 at $1,724 will be the level to beat for buyers.
Here is how it looks on the tool
About Technical Confluences Detector
The TCD (Technical Confluences Detector) is a tool to locate and point out those price levels where there is a congestion of indicators, moving averages, Fibonacci levels, Pivot Points, etc. If you are a short-term trader, you will find entry points for counter-trend strategies and hunt a few points at a time. If you are a medium-to-long-term trader, this tool will allow you to know in advance the price levels where a medium-to-long-term trend may stop and rest, where to unwind positions, or where to increase your position size.
Author

Dhwani Mehta
FXStreet
Residing in Mumbai (India), Dhwani is a Senior Analyst and Manager of the Asian session at FXStreet. She has over 10 years of experience in analyzing and covering the global financial markets, with specialization in Forex and commodities markets.


