Gold Price Forecast: XAU/USD extends winning streak on renewed global trade tensions
- Gold price rises to near $3,340 as Trump’s fresh tariff threats have increased demand for safe-haven assets.
- US President Trump imposes 35% tariffs on Canada and prepares to announce additional duties on the EU.
- Investors shift their focus to the US inflation data for June.

Gold price (XAU/USD) extends its winning streak for the third trading day on Friday. The yellow metal jumps to near $3,340 as demand for safe-haven assets has increased after United States (US) President Donald Trump threatens to increase the blanket levy to “15% or 20%” from 10% announced on so-called “Liberation Day” on April 2.
Fresh tariff threats from US President Trump have jolted demand for riskier assets across the globe. On Thursday, Trump said in a telephone interview with NBC News that he could announce 15% or 20% tariffs on nations that have failed to close a deal during the 90-day reciprocal tariff pause period.
“We’re just going to say all of the remaining countries are going to pay, whether it’s 20% or 15%. We’ll work that out now,” Trump said.
On Thursday, Trump also announced 35% tariffs on Canada and stated that he will reveal additional duties on imports from the European Union (EU) today or tomorrow.
Trade tensions between the US and the EU are expected to disrupt global trade, considering the size of business between both economies.
Going forward, the next major trigger for the Gold price will be the US Consumer Price Index (CPI) data for June, which will be released on Tuesday. Theoretically, Gold outperforms in a high-inflation environment.
Gold technical analysis
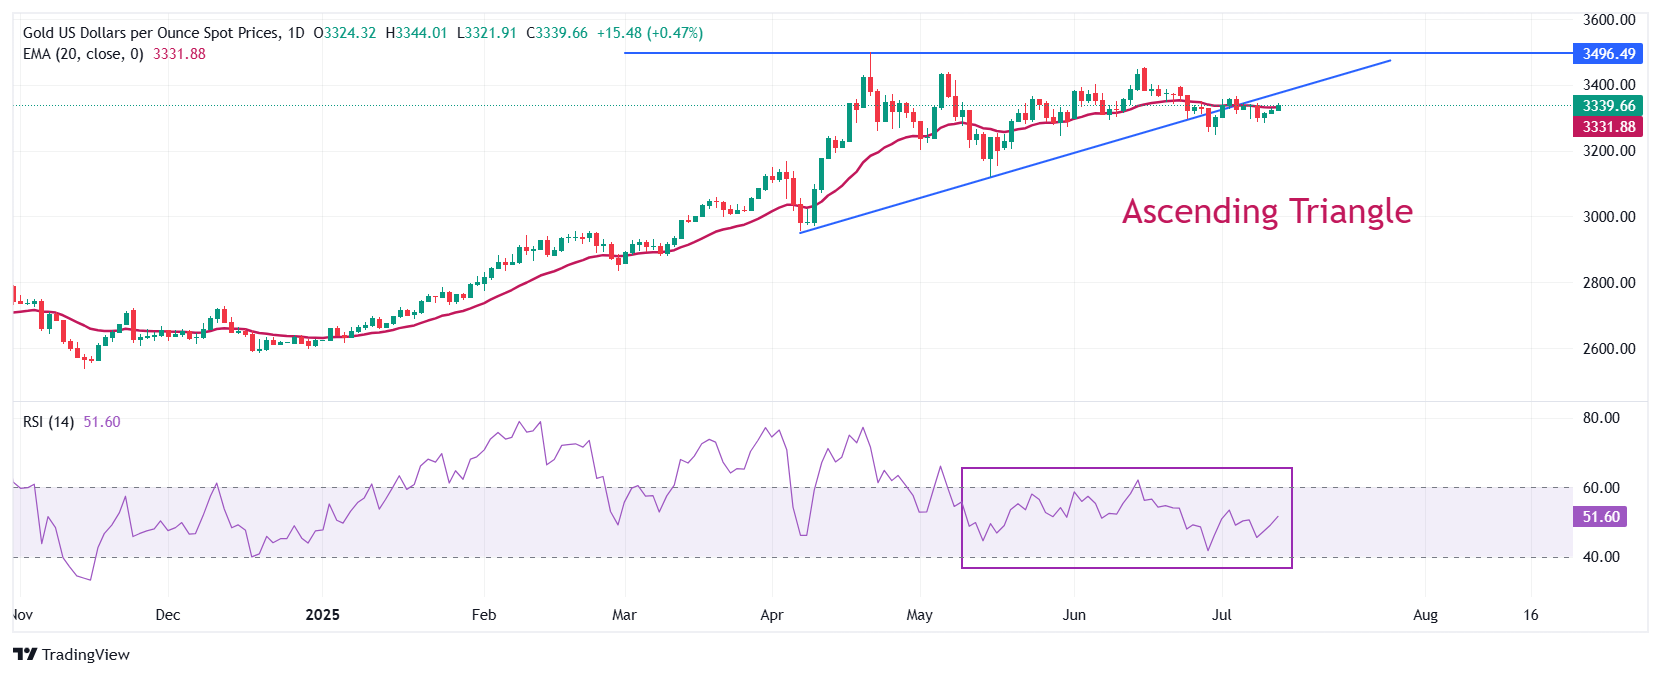
Gold price recovers to near the 20-day Exponential Moving Average (EMA), which trades around $3,330. The precious metal stays below the Ascending Triangle formation on a daily timeframe.
Theoretically, a breakdown of the asset below the upward-sloping trendline of the above-mentioned chart pattern, which is placed from the April 7 low of $2,957, results in a sharp downfall. The horizontal resistance of the chart formation is plotted from the April 22 high around $3,500.
The 14-day Relative Strength Index (RSI) oscillates inside the 40.00-60.00 range, indicating a sideways trend.
Looking down, the Gold price would fall towards the round-level support of $3,200 and the May 15 low at $3,121, if it breaks below the May 29 low of $3,245
Alternatively, the Gold price will enter an uncharted territory if it breaks above the psychological level of $3,500 decisively. Potential resistances would be $3,550 and $3,600.
Gold daily chart
Gold FAQs
Gold has played a key role in human’s history as it has been widely used as a store of value and medium of exchange. Currently, apart from its shine and usage for jewelry, the precious metal is widely seen as a safe-haven asset, meaning that it is considered a good investment during turbulent times. Gold is also widely seen as a hedge against inflation and against depreciating currencies as it doesn’t rely on any specific issuer or government.
Central banks are the biggest Gold holders. In their aim to support their currencies in turbulent times, central banks tend to diversify their reserves and buy Gold to improve the perceived strength of the economy and the currency. High Gold reserves can be a source of trust for a country’s solvency. Central banks added 1,136 tonnes of Gold worth around $70 billion to their reserves in 2022, according to data from the World Gold Council. This is the highest yearly purchase since records began. Central banks from emerging economies such as China, India and Turkey are quickly increasing their Gold reserves.
Gold has an inverse correlation with the US Dollar and US Treasuries, which are both major reserve and safe-haven assets. When the Dollar depreciates, Gold tends to rise, enabling investors and central banks to diversify their assets in turbulent times. Gold is also inversely correlated with risk assets. A rally in the stock market tends to weaken Gold price, while sell-offs in riskier markets tend to favor the precious metal.
The price can move due to a wide range of factors. Geopolitical instability or fears of a deep recession can quickly make Gold price escalate due to its safe-haven status. As a yield-less asset, Gold tends to rise with lower interest rates, while higher cost of money usually weighs down on the yellow metal. Still, most moves depend on how the US Dollar (USD) behaves as the asset is priced in dollars (XAU/USD). A strong Dollar tends to keep the price of Gold controlled, whereas a weaker Dollar is likely to push Gold prices up.
Author

Sagar Dua
FXStreet
Sagar Dua is associated with the financial markets from his college days. Along with pursuing post-graduation in Commerce in 2014, he started his markets training with chart analysis.


