Gold Price Forecast: XAU/USD extends recovery to near $1,920 as USD Index loses upside momentum
- Gold price has stretched its recovery to near $1,920.00 as the upside momentum in the USD Index is exhausting.
- The overall risk profile is negative as investors are worried about global economic prospects due to a hawkish stance by central banks.
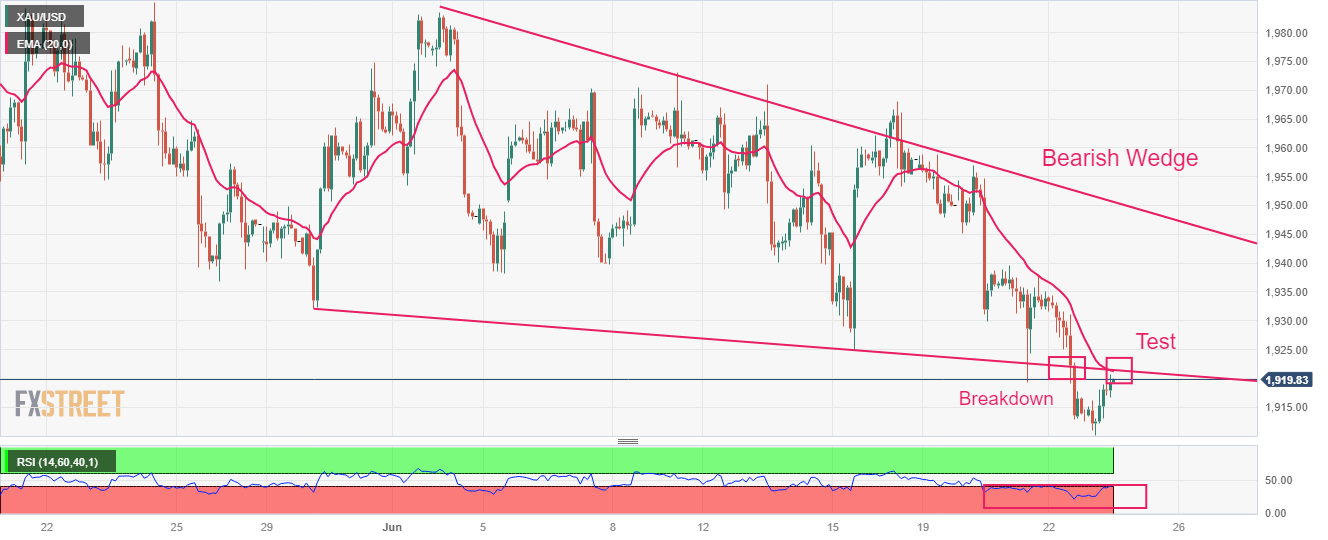
- Gold price has shown a minor recovery to test the breakdown region of the Bearish Wedge chart pattern around $1,921.11.

Gold price (XAU/USD) has stretched its recovery to near $1,920.00 in the European session. The precious metal found strength near $1,912.00 as the US Dollar Index (DXY) has shown signs of exhaustion in the upside momentum.
S&P500 futures have generated immense losses overnight, which are solidifying a negative opening ahead. The overall risk profile is negative as investors are worried about global economic prospects due to a hawkish stance by central banks. The US Dollar Index (DXY) has corrected to near 103.00, however, the upside is still solid as Federal Reserve (Fed) chair Jerome Powell has confirmed that more rate hikes are appropriate but at a careful pace.
Fed Governor Michelle Bowman didn’t specify her estimate of how high the Fed may need to move rates, said on Thursday further "rate increases" were needed - indicating she feels at least two more hikes are warranted, as reported by Reuters.
Going forward, US preliminary S&P PMI (June) will be in focus. Analysts at TD Securities noted that “the S&P PMIs will offer a first comprehensive look at the state of the US economy for early June. Note that the manufacturing PMI registered its first decline this year in May, while the services PMI continued to improve, posting its fifth consecutive gain last month. We expect the manufacturing index to improve but to stay under contraction territory, while the services PMI likely lost speed.”
Gold technical analysis
Gold price has shown a minor recovery to test the breakdown region of the Bearish Wedge chart pattern around $1,921.11 on a two-hour scale. The precious metal is broadly in a negative trajectory. The 20-period Exponential Moving Average (EMA) at $1,921.46 might continue to act as a barricade for the Gold bulls.
The Relative Strength Index (RSI) (14) is oscillating in the bearish range of 20.00-40.00, which indicates that the downside momentum is active.
Gold two-hour chart
Author

Sagar Dua
FXStreet
Sagar Dua is associated with the financial markets from his college days. Along with pursuing post-graduation in Commerce in 2014, he started his markets training with chart analysis.