Gold Price Forecast: XAU/USD extends recovery above $1,990 as USD Index corrects, US Inflation in spotlight
- Gold price has stretched its recovery above $1,990.00, however, the downside remains favored.
- US labor market conditions remained tight despite tight credit conditions from US banks and high rates from the Fed.
- A surprise rebound is expected in US core inflation as earnings data is still higher due to a shortage of labor.

Gold price (XAU/USD) recovered after printing a three-day low at $1,981.38 in the Asian session. The precious metal has stretched its recovery above $1,990.00 as the US Dollar Index (DXY) has witnessed a correction after a five-day high at 102.81. The recovery move in the Gold price could be a pullback move only, and the downside journey would resume as investors are expected to remain anxious ahead of the United States inflation data, which is scheduled for Wednesday.
Meanwhile, S&P500 ended Monday’s session with nominal gains as the recovery move came to post a gap-down opening due to volatility inspired by the extended weekend. The US Treasury Yields recovered losses and settled above 3.41% on Monday as the Federal Reserve (Fed) is expected to hike rates again next month.
Earlier, the street was anticipating that Fed chair Jerome Powell would consider an early pause in the policy-tightening spell as tight credit conditions and higher rates would slow down the economy dramatically. However, tight labor market conditions have confirmed that a shortage of labor would be there, which will be offset by higher offerings.
This week, the annual Average Hourly Earnings data softened to 4.2% but is well above against consistency required to tame stubborn inflation.
Going forward, the US Consumer Price Index (CPI) data will remain in the spotlight. A surprise rebound in the US inflation would cement the need for one more rate hike from the Fed. As per the consensus, the headline inflation will soften to 5.2% from the former release of 6.0%. Also, monthly headline CPI would decelerate to 0.3% from 0.4% reported earlier. While annual core inflation that excludes oil and food prices could surprisingly jump to 5.6% from the former release of 5.5%.
Gold technical analysis
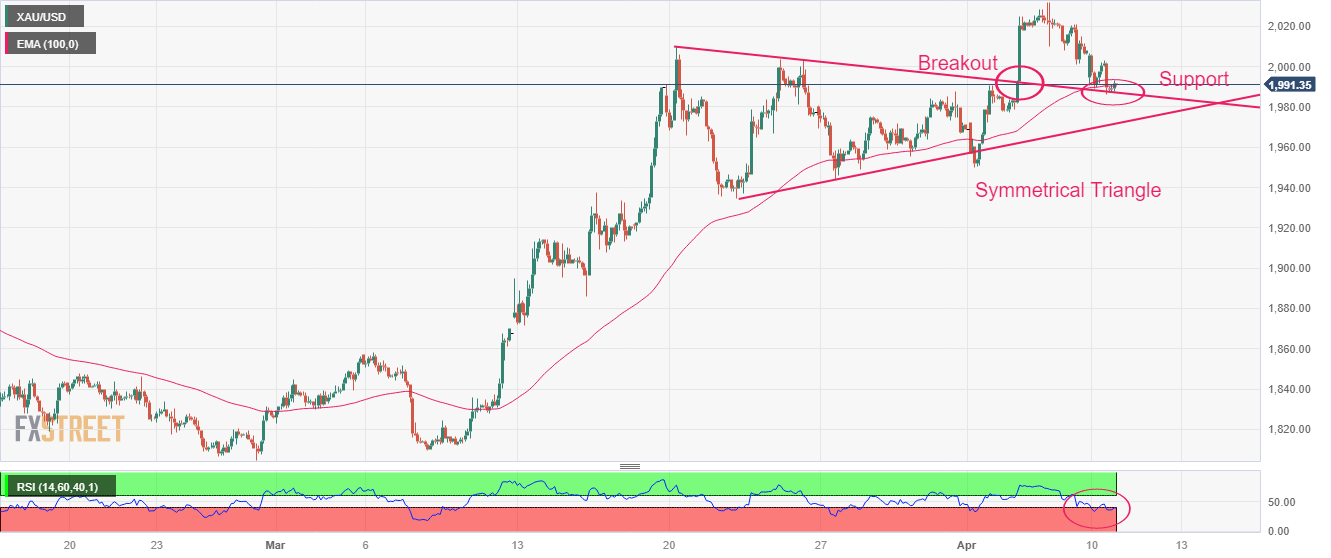
Gold price has corrected sharply to nearly $1,987.00 after a breakout from the Symmetrical Triangle chart pattern formed on a two-hour scale. The precious metal is at a make-or-a-break level, as a breakdown from this level would trigger further weakness in the Gold price.
The 100-period Exponential Moving Average (EMA) at $1,991.00 provides a cushion to the Gold price.
Meanwhile, the Relative Strength Index (RSI) (14) is defending itself from shifting into the bearish range of 20.00-40.00.
Gold two-hour chart
Author

Sagar Dua
FXStreet
Sagar Dua is associated with the financial markets from his college days. Along with pursuing post-graduation in Commerce in 2014, he started his markets training with chart analysis.


