Gold Price Forecast: XAU/USD retreats to $1,760 area as dollar regains strength
- Gold preserves its bullish momentum ahead of the American session.
- 10-year US Treasury bond yield stays in the negative territory.
- Dollar struggles to find demand ahead of US inflation data.

Update: Gold fell sharply in the early American session and gave back its daily gains with the greenback regaining its footing following the September US inflation data. The US Bureau of Labor Statistics announced on Wednesday that the Core Consumer Price Index (CPI) stayed unchanged at 4% on a yearly basis while the CPI edged higher to 5.4% from 5.3% in August. Reflecting the renewed dollar strength, the US Dollar Index is posting small daily losses at 94.40. Meanwhile, the 10-year US Treasury bond yield is now in the positive territory, rising 0.4% at 1.587% and putting additional weight on the XAU/USD pair's shoulders.
The XAU/USD pair struggled to make a decisive move in either direction in the first couple of days of the week but managed to gain traction ahead of US inflation data on Wednesday. The renewed USD weakness and falling US Treasury bond yields seem to be helping the pair push higher. As of writing, gold was up 0.7% on the day at $1,772.
In the absence of significant data releases and fundamental developments, the positive shift witnessed in market sentiment is making it difficult for the greenback to find demand. With the US stocks futures rising between 0.2% and 0.5%, the US Dollar Index is falling 0.25% on the day at 92.28 to punctuate the broad-based dollar weakness.
Meanwhile, the benchmark 10-year US Treasury bond yield, which fell 3.25% on Tuesday, is staying in the negative territory, providing an additional boost to XAU/USD.
Previewing the Consumer Price Index (CPI) data, "markets are keenly aware that price increases are again playing a part in Fed policy even if the rhetoric is muted," said FXStreet Senior Analyst Joseph Trevisani. "The credit markets tell the story. As inflation rises so should Treasury yields and the dollar. "
US Consumer Price Index September Preview: Inflation averaging, what inflation averaging?
Gold technical outlook
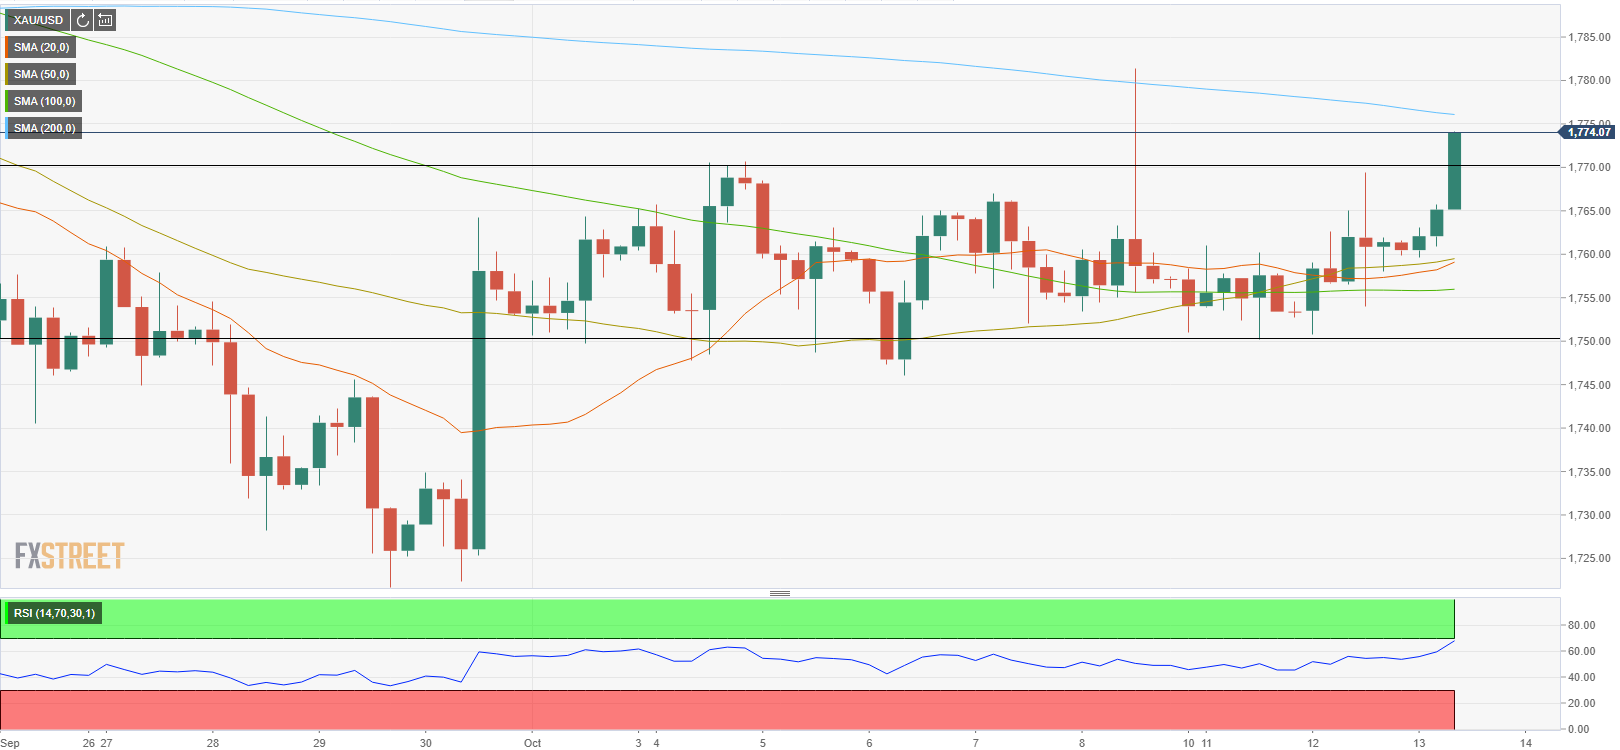
On the four-hour chart, gold is currently trading above the two-week-old trading range and a daily close above $1,770 could open the door for additional gains. However, the Relative Strength Index (RSI) indicator on the same chart is closing in on 70, suggesting that there could be a technical correction before the next leg up.
On the upside, the 200-period SMA acts as the first resistance at $1,775 ahead of $1,787 (September 22 high) and $1,800 (psychological level).
The initial support is now located at $1,770 (former resistance) before $1,760 (50-period SMA) and $1,755 (100-period SMA).
Author

Eren Sengezer
FXStreet
As an economist at heart, Eren Sengezer specializes in the assessment of the short-term and long-term impacts of macroeconomic data, central bank policies and political developments on financial assets.
















