Gold Price Forecast: XAU/USD extends backslide, markets gear up for Fed rate call


  • XAU/USD continues decline that started last Friday, sheds $2,000.
  • Markets are coiling up in preparation for another round of US inflation, Fed rate call.
  • Fed interest rate forecast 'dot plot' to drive market momentum into the midweek.

Spot Gold saw further declines on Monday, slipping back below the $2,000 handle to ease into the $1,980 neighborhood as markets get set for a fresh round of US Consumer Price Index (CPI) inflation figures on Tuesday. Wednesday will follow up with a mid-week showing from the Federal Reserve (Fed) for the US central bank’s last rate call of 2023.

Forex Today: Quiet markets ahead of US CPI and the Fed; Gold extends slide

US CPI inflation is expected to mix on the front end of the curve, with Core CPI (headline inflation less volatile food and energy prices) is expected to jump from 0.2% to 0.3% MoM in November, while the YoY figure is forecast to tick down slightly from 3.2% to 3.1%. Markets have coalesced into a mass of rate cut expectations from the Fed, but inflation continues to print well above the 2% upper bound of the Fed’s Core CPI target range.

See more: Forecasts from 10 major banks, crushing rate cut prospects

Wednesday will follow up with the Fed’s latest Monetary Policy Statement and Interest Rate Projections, slated to release side-by-side at 19:00 GMT. Market participants seeking an accelerated path to Fed rate cuts will be diving into the Fed’s Dot Plot, looking for signs the central bank is getting pushed towards rate cuts that investors are broadly hoping for in the first half of 2024.

The Fed’s press conference slated for half an hour after the rate statement and dot plot releases at 19:30 GMT is set to draw significant market attention for the midweek trading hump.

XAU/USD Technical Outlook

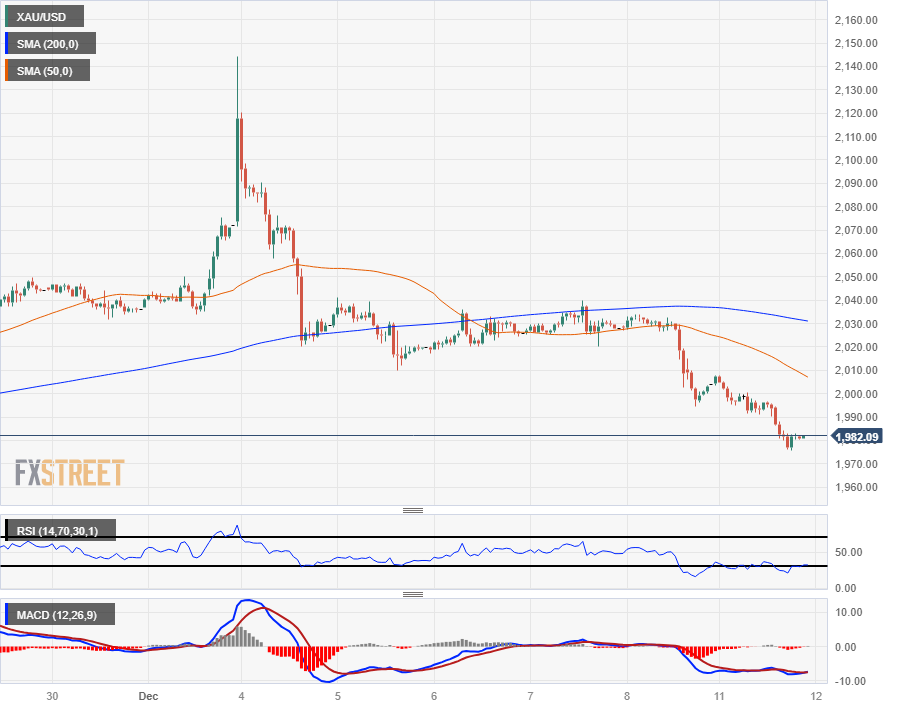
Gold’s Monday decline extends the XAU/USD’s slip from the 200-hour Simple Moving Average (SMA) last Friday, shedding the $2,000 major price handle to test back into the $1,980 level. Spot Gold is now down seven and a half percent  from last week’s early rally just beyond $2,140, and near-term consolidation has etched in a technical sticking area near $2,030.

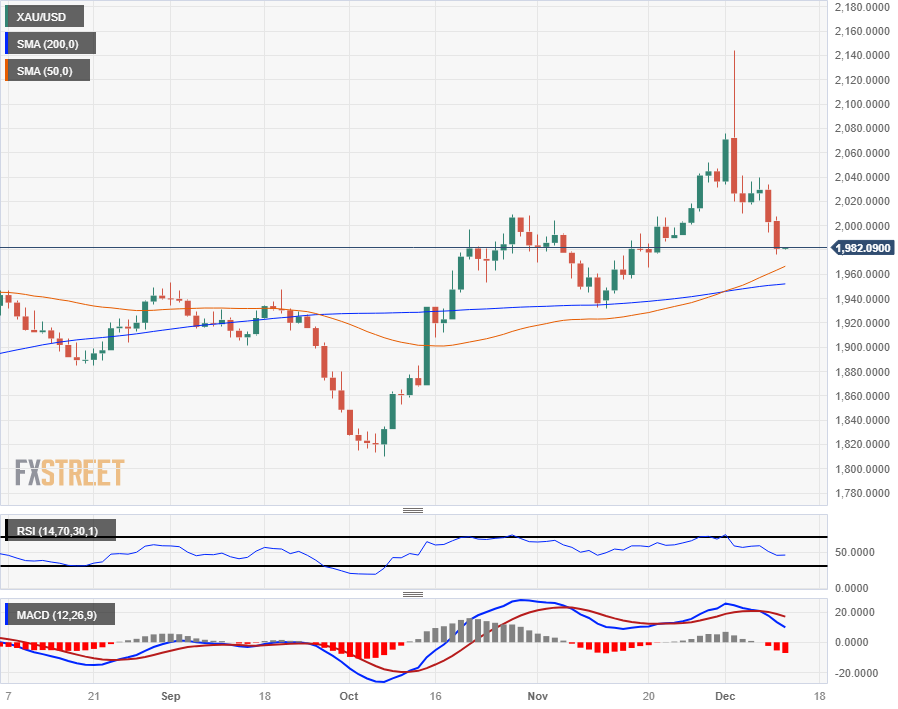
Daily candlesticks have been propped up on the bullish side of the 200-day SMA since bouncing from the key moving average in November near $1,940, and near-term declines are setting the XAU/USD up for a pullback to the 50-day SMA that has confirmed a bullish cross of the 200-day SMA.

Further declines into $1,960 could set up bulls for a rebound into recent highs, though market reactions to the mid-week economic calendar releases will introduce plenty of froth, rattling technical setups.

XAU/USD Hourly Chart

XAU/USD Daily Chart

XAU/USD Technical Levels

XAU/USD

Overview
Today last price 1982.09
Today Daily Change -20.81
Today Daily Change % -1.04
Today daily open 2002.9
 
Trends
Daily SMA20 2005.27
Daily SMA50 1960.37
Daily SMA100 1940.83
Daily SMA200 1950.8
 
Levels
Previous Daily High 2034.07
Previous Daily Low 1994.71
Previous Weekly High 2144.48
Previous Weekly Low 1994.71
Previous Monthly High 2052.03
Previous Monthly Low 1931.67
Daily Fibonacci 38.2% 2009.75
Daily Fibonacci 61.8% 2019.03
Daily Pivot Point S1 1987.05
Daily Pivot Point S2 1971.2
Daily Pivot Point S3 1947.69
Daily Pivot Point R1 2026.41
Daily Pivot Point R2 2049.92
Daily Pivot Point R3 2065.77


Share: Feed news

Information on these pages contains forward-looking statements that involve risks and uncertainties. Markets and instruments profiled on this page are for informational purposes only and should not in any way come across as a recommendation to buy or sell in these assets. You should do your own thorough research before making any investment decisions. FXStreet does not in any way guarantee that this information is free from mistakes, errors, or material misstatements. It also does not guarantee that this information is of a timely nature. Investing in Open Markets involves a great deal of risk, including the loss of all or a portion of your investment, as well as emotional distress. All risks, losses and costs associated with investing, including total loss of principal, are your responsibility. The views and opinions expressed in this article are those of the authors and do not necessarily reflect the official policy or position of FXStreet nor its advertisers. The author will not be held responsible for information that is found at the end of links posted on this page.

If not otherwise explicitly mentioned in the body of the article, at the time of writing, the author has no position in any stock mentioned in this article and no business relationship with any company mentioned. The author has not received compensation for writing this article, other than from FXStreet.

FXStreet and the author do not provide personalized recommendations. The author makes no representations as to the accuracy, completeness, or suitability of this information. FXStreet and the author will not be liable for any errors, omissions or any losses, injuries or damages arising from this information and its display or use. Errors and omissions excepted.

The author and FXStreet are not registered investment advisors and nothing in this article is intended to be investment advice.

Recommended content


Recommended content

Editors’ Picks

EUR/USD bounces off lows, approaches 1.1550

EUR/USD bounces off lows, approaches 1.1550

EUR/USD continues to recover ground lost and now extends the rebound to the 1.1550 zone on Friday. Meanwhile, the US Dollar maintain its bullish bias intact in response to a significant flight to safety amid increasing geopolitical concerns, while positive consumer sentiment data also contribute to the daily uptick.

Gold keeps the trade above $3,400 on safe-haven demand

Gold keeps the trade above $3,400 on safe-haven demand

Gold prices maintain its upward trajectory on Friday, reaching its peak level since late April above the $3,400 mark per troy ounce. Furthermore, the precious metal draws increased safe-haven interest amid escalating tensions in the Middle East, triggered by Israel's military action against Iran.

GBP/USD trims losses, retargets 1.3600

GBP/USD trims losses, retargets 1.3600

After an earlier dip toward the 1.3520 area, GBP/USD has regained some composure, trading within sight of the key 1.3600 barrier as the week draws to a close. The pair remains under pressure on Friday, weighed down by renewed US Dollar strength amid rising risk aversion and a stronger-than-expected consumer confidence report.

Crypto Today: Bitcoin, Ethereum, XRP clamber for support amid escalating volatility on Israel-Iran tensions

Crypto Today: Bitcoin, Ethereum, XRP clamber for support amid escalating volatility on Israel-Iran tensions

The cryptocurrency market has been hit by a sudden wave of extreme volatility, triggering widespread declines as global markets react to tensions between Israel and Iran. Bitcoin is hovering at around $104,668 at the time of writing on Friday, following a reflex recovery from support tested at $102,513.

Week ahead – Markets brace for central bank barrage amid heightened uncertainty

Week ahead – Markets brace for central bank barrage amid heightened uncertainty

Fed officials to stand pat as they await further clarity. A dovish BoJ could push rate hike expectations into 2026. Deflation fuels speculation about negative SNB rates. BoE may sound more dovish after disappointing UK data.

The Best brokers to trade EUR/USD

The Best brokers to trade EUR/USD

SPONSORED Discover the top brokers for trading EUR/USD in 2025. Our list features brokers with competitive spreads, fast execution, and powerful platforms. Whether you're a beginner or an expert, find the right partner to navigate the dynamic Forex market.

Forex MAJORS

Cryptocurrencies

Signatures

Best Brokers of 2025