|

Gold Price Forecast: XAU/USD drops sharply below $1,960 as USD Index extends recovery

  • Gold price has attempted a downside break of the consolidation formed above $1,960.00 amid a recovery in the USD Index.
  • The expectations of a temporary pause in the policy-tightening spell by the Fed have soared due to weak US Services PMI.
  • Gold price is consolidating in a range of $1,932-1,985 for the past three weeks.

Gold price (XAU/USD) has displayed a sharp drop to near $1,960.00 in the European session. The precious metal is trying to come out of the woods. A minor sell-off in the Gold price has been propelled by a recovery extension in the US Dollar Index (DXY).

S&P500 futures have carry-forwarded nominal gains added in Asia to the London session. The market mood is quite cheerful as investors are anticipating that the Federal Reserve (Fed) is going to consider a neutral interest rate policy stance thoroughly for June’s monetary policy.

The expectations of a temporary pause in the policy-tightening spell by the Fed have soared after the United States Services PMI, reported by the ISM agency, hardly managed to dodge contraction. The economic data was marginally above the 50.0 threshold. Subdued service sector and contracting factory activities are pushing the United States economy aggressively toward a recession.

The US Dollar Index has rebounded to near 104.25 despite the street is anticipating that divergence in Fed’s interest rate policy with other global central banks will drop as the former is likely to keep rates steady while others are preparing for a fresh interest rate hike. The yields offered on 10-year US government bonds have also rebounded marginally above 3.66%.

Gold technical analysis

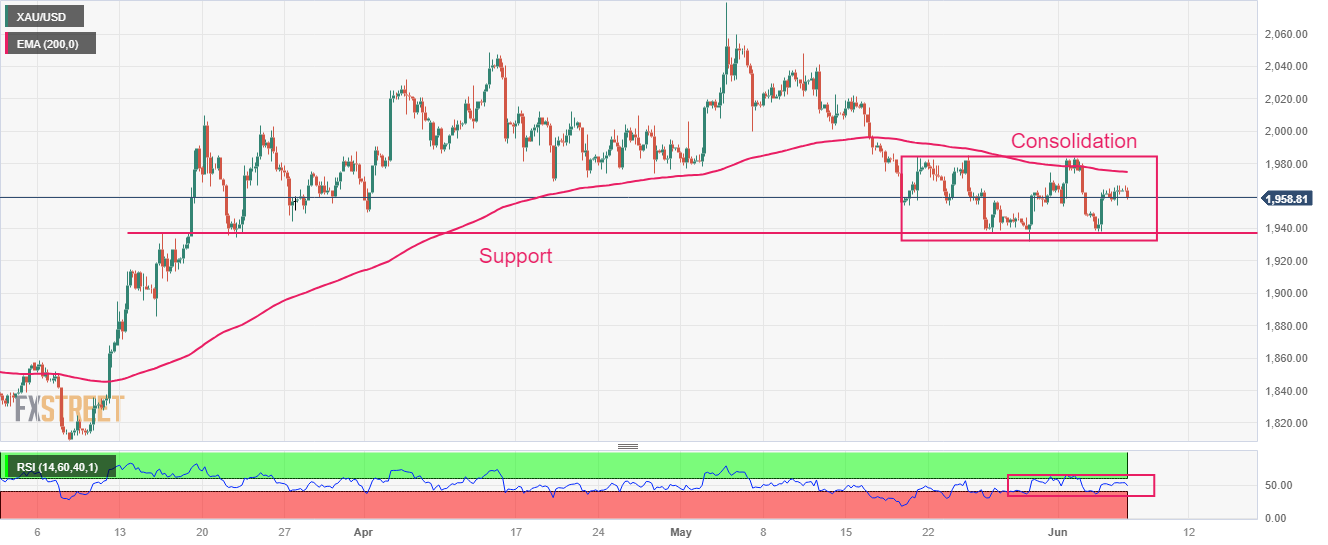
Gold price is consolidating in a range of $1,932-1,985 for the past three weeks on a four-hour. The precious metal is struggling in delivering a decisive move amid an absence of a potential trigger. Broadly, horizontal support is plotted from March 15 high at $1,937.39. The magical 200-period Exponential Moving Average (EMA) at $1,975.47 is acting as a strong barrier for the Gold bulls.

An oscillation in the 40.00-60.00 territory by the Relative Strength Index (RSI) (14) indicates a non-directional performance.

Gold four-hour chart

XAU/USD

Overview
Today last price1958.95
Today Daily Change-4.65
Today Daily Change %-0.24
Today daily open1963.6
 
Trends
Daily SMA201974.4
Daily SMA501991.22
Daily SMA1001940
Daily SMA2001837.93
 
Levels
Previous Daily High1966.43
Previous Daily Low1954.43
Previous Weekly High1983.5
Previous Weekly Low1932.12
Previous Monthly High2079.76
Previous Monthly Low1932.12
Daily Fibonacci 38.2%1961.85
Daily Fibonacci 61.8%1959.01
Daily Pivot Point S11956.54
Daily Pivot Point S21949.49
Daily Pivot Point S31944.54
Daily Pivot Point R11968.54
Daily Pivot Point R21973.49
Daily Pivot Point R31980.54

Author

Sagar Dua

Sagar Dua

FXStreet

Sagar Dua is associated with the financial markets from his college days. Along with pursuing post-graduation in Commerce in 2014, he started his markets training with chart analysis.

More from Sagar Dua
Share:

Editor's Picks

EUR/USD challenges 1.1700, six-week lows

EUR/USD remains under heavy downside pressire in quite a dfrreadful start to the new trading week, putting the 1.1700 support to the test amid the marked rebound in the US Dollar. The flight-so-safety environment continues to support the Greenback following the escalating conflict in the Middle East.

GBP/USD hits new yearly lows near 1.3300

GBP/USD adds to the recent bearish tone, approaching to the key 1.3300 support to reach fresh YTD troughs against the backdrop of the robust performance of the US Dollar. Indeed, Cable’s decline comes amid the firm demand for the safe-haven space in the wake of the US and Israel attacks to Iran.

Gold shifts its attention to $5,600 on fligh-to-safety mood

Gold climbs to levels last seen in late January past the $5,400 mark per troy ounce on Monday. The yellow metal’s strong uptick remains fuelled by incresing geopolitical tensions in the Middle East and the consequent demand for safer assets.

Bitcoin on brink of breakdown amid US-Iran war

Bitcoin (BTC) remains under pressure near the key support level of $65,700. Trading at $66,400 at the time of writing on Monday, a breakdown below this critical level would suggest a deeper correction ahead.

The week ahead: Conflict in the Middle East jolts markets

Events in the Middle East are obviously dominating financial markets this morning. The Brent crude oil price is extending gains and is higher by more than 8%, stock futures are pointing lower and the gold price is higher by more than 2%. 

Pi Network Price Forecast: Core team offloads supply, weighing on PI recovery

Pi Network  hovers below $0.1700, broadly steady at press time on Monday, attempting a recovery after a 2% loss the previous day. Sunday’s decline aligned with nearly 49 million PI tokens offloaded by the Pi Foundation, implying a spike in supply pressure that capped the prevailing four-day recovery.