Gold Price Forecast: XAU/USD downside opening up towards $1,817 – Confluence Detector


Gold Price is testing the critical support, licking its wounds near three-months troughs below $1,850. The resurgent US dollar haven demand amid looming global growth and inflation fears weighed negatively on Gold Price, as traders ignored the pullback in the Treasury yields from multi-year highs. Additionally, hawkish Fedspeak also boosted the US dollar, exacerbating the pain in XAU/USD. Attention turns towards the critical US inflation release for a fresh direction in Gold Price.

Also read: US April CPI Preview: Has inflation peaked?

Gold Price: Key levels to watch

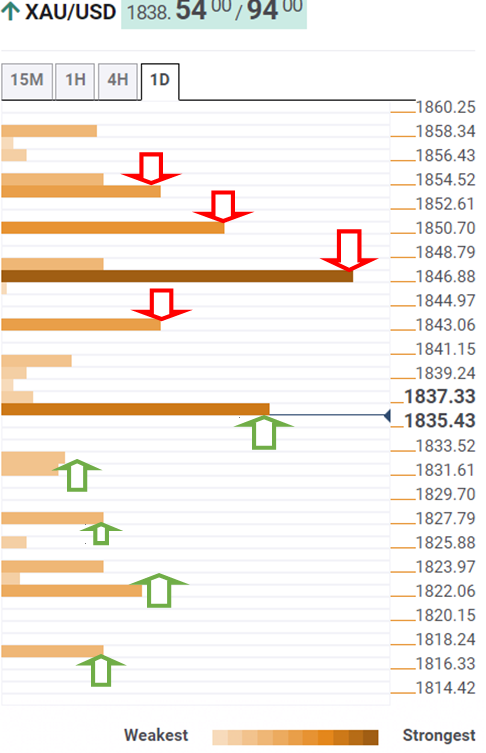
The Technical Confluences Detector shows that the Gold Price is testing the bullish commitments at critical support of $1,836. At that level, the SMA200 one-day, the previous day’s low and SMA5 one-hour coincide.

The next relevant support awaits at the previous low four-hour at $1,833, below which a fresh drop towards the pivot point one-day S1 at $1,827 cannot be ruled out.

Further down, sellers will target the pivot point one-week S2 at $1,822. The last line of defense for gold bulls is seen at $1,817, the pivot point one-day S2.

On the upside, any recovery could gain momentum only on a sustained break above the previous high four-hour at $1,841, above which the Fibonacci 23.6% one-day could be tested.

The confluence of the pivot point one-month S1 and Fibonacci 38.2% one-day at $1,847 will come into play.

The previous week’s low at $1,850 could be also on the buyers’ radars, opening gates towards $1,853, the intersection of the Fibonacci 61.8% one-day and pivot point one-week S1.

Here is how it looks on the tool

 fxsoriginal

About Technical Confluences Detector

The TCD (Technical Confluences Detector) is a tool to locate and point out those price levels where there is a congestion of indicators, moving averages, Fibonacci levels, Pivot Points, etc.  If you are a short-term trader, you will find entry points for counter-trend strategies and hunt a few points at a time. If you are a medium-to-long-term trader, this tool will allow you to know in advance the price levels where a medium-to-long-term trend may stop and rest, where to unwind positions, or where to increase your position size.

Share: Feed news

Information on these pages contains forward-looking statements that involve risks and uncertainties. Markets and instruments profiled on this page are for informational purposes only and should not in any way come across as a recommendation to buy or sell in these assets. You should do your own thorough research before making any investment decisions. FXStreet does not in any way guarantee that this information is free from mistakes, errors, or material misstatements. It also does not guarantee that this information is of a timely nature. Investing in Open Markets involves a great deal of risk, including the loss of all or a portion of your investment, as well as emotional distress. All risks, losses and costs associated with investing, including total loss of principal, are your responsibility. The views and opinions expressed in this article are those of the authors and do not necessarily reflect the official policy or position of FXStreet nor its advertisers. The author will not be held responsible for information that is found at the end of links posted on this page.

If not otherwise explicitly mentioned in the body of the article, at the time of writing, the author has no position in any stock mentioned in this article and no business relationship with any company mentioned. The author has not received compensation for writing this article, other than from FXStreet.

FXStreet and the author do not provide personalized recommendations. The author makes no representations as to the accuracy, completeness, or suitability of this information. FXStreet and the author will not be liable for any errors, omissions or any losses, injuries or damages arising from this information and its display or use. Errors and omissions excepted.

The author and FXStreet are not registered investment advisors and nothing in this article is intended to be investment advice.

Recommended content


Recommended content

Editors’ Picks

EUR/USD clings to daily gains above 1.0650

EUR/USD clings to daily gains above 1.0650

EUR/USD gained traction and turned positive on the day above 1.0650. The improvement seen in risk mood following the earlier flight to safety weighs on the US Dollar ahead of the weekend and helps the pair push higher.

EUR/USD News

GBP/USD recovers toward 1.2450 after UK Retail Sales data

GBP/USD recovers toward 1.2450 after UK Retail Sales data

GBP/USD reversed its direction and advanced to the 1.2450 area after touching a fresh multi-month low below 1.2400 in the Asian session. The positive shift seen in risk mood on easing fears over a deepening Iran-Israel conflict supports the pair.

GBP/USD News

Gold holds steady at around $2,380 following earlier spike

Gold holds steady at around $2,380 following earlier spike

Gold stabilized near $2,380 after spiking above $2,400 with the immediate reaction to reports of Israel striking Iran. Meanwhile, the pullback seen in the US Treasury bond yields helps XAU/USD hold its ground.

Gold News

Bitcoin Weekly Forecast: BTC post-halving rally could be partially priced in Premium

Bitcoin Weekly Forecast: BTC post-halving rally could be partially priced in

Bitcoin price shows no signs of directional bias while it holds above  $60,000. The fourth BTC halving is partially priced in, according to Deutsche Bank’s research. 

Read more

Week ahead – US GDP and BoJ decision on top of next week’s agenda

Week ahead – US GDP and BoJ decision on top of next week’s agenda

US GDP, core PCE and PMIs the next tests for the Dollar. Investors await BoJ for guidance about next rate hike. EU and UK PMIs, as well as Australian CPIs also on tap.

Read more

Forex MAJORS

Cryptocurrencies

Signatures