|

Gold Price Forecast: XAU/USD defends $1950 as US yields drop ahead of US job data and Fed’s Beige Book

  • Gold price has defended its crucial support around $1,950.00, supported by weak US Treasury yields.
  • The USD Index has delivered a V-shape recovery after defending the crucial support of 104.00 amid hawkish Fed bets.
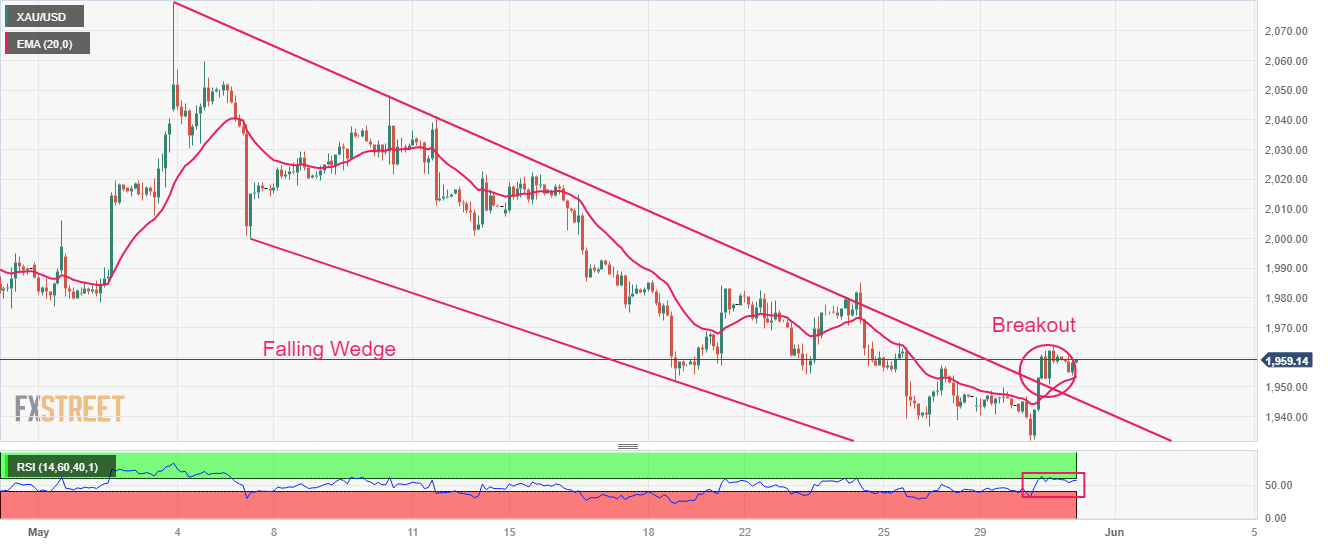
  • Gold price has turned sideways around $1,960.00 after delivering a breakout of the Falling Wedge pattern.

Gold price (XAU/USD) has shown some recovery after defending its close support of $1,950.00 in the Tokyo session. Broadly, the precious metal is consolidating in a range of $1,953-1,960 as investors are awaiting the release of the United States Employment data.

S&P500 futures have added more losses in Asia, portraying a decline in the risk appetite of the market participants. The US Dollar Index (DXY) has delivered a V-shape recovery after defending the crucial support of 104.00.

Investors should note that Gold price has managed to defend the downside despite extreme strength in the US Dollar bulls. The Gold price is being supported by falling US Treasury yields. Growing optimism about a clear passage for the novel US debt-ceiling proposal in Congress has weighed heavily on the US Treasury yields. The yields offered on 10-year US government bonds have dropped 3.68%.

A conservative approach should be taken as the Gold price could face pressure considering the strength of the US Dollar and deepening expectations of one more interest rate hike by the Federal Reserve (Fed).

Going forward, US JOTLS Job Openings data and the release of Fed’s Beige Book will be keenly watched. According to the estimates, total job openings have dropped to 9.375M vs. the former release of 9.59M.

Gold technical analysis

Gold price has turned sideways around $1,960.00 after delivering a breakout of the Falling Wedge chart pattern formed on a two-hour scale. A breakout of the aforementioned pattern indicates a bullish reversal. The 20-period Exponential Moving Average (EMA) at $1,953.36 is providing a cushion to the Gold bulls.

The Relative Strength Index (RSI) (14) is making efforts for shifting into the bullish range of 60.00-80.00. An occurrence of the same will be followed by activation of the bullish momentum.

Gold two-hour chart

XAU/USD

Overview
Today last price1959.18
Today Daily Change-0.10
Today Daily Change %-0.01
Today daily open1959.28
 
Trends
Daily SMA201991.79
Daily SMA501991.7
Daily SMA1001936.74
Daily SMA2001832.52
 
Levels
Previous Daily High1963.56
Previous Daily Low1932.12
Previous Weekly High1985.3
Previous Weekly Low1936.77
Previous Monthly High2048.75
Previous Monthly Low1949.83
Daily Fibonacci 38.2%1951.55
Daily Fibonacci 61.8%1944.13
Daily Pivot Point S11939.75
Daily Pivot Point S21920.21
Daily Pivot Point S31908.31
Daily Pivot Point R11971.19
Daily Pivot Point R21983.09
Daily Pivot Point R32002.63

Author

Sagar Dua

Sagar Dua

FXStreet

Sagar Dua is associated with the financial markets from his college days. Along with pursuing post-graduation in Commerce in 2014, he started his markets training with chart analysis.

More from Sagar Dua
Share:

Markets move fast. We move first.

Orange Juice Newsletter brings you expert driven insights - not headlines. Every day on your inbox.

By subscribing you agree to our Terms and conditions.

Editor's Picks

EUR/USD retreats below 1.1750 on modest USD recovery

EUR/USD stays under modest bearish pressure and trades below 1.1750 on Friday. Although trading conditions remain thin following the New Year holiday and ahead of the weekend, the modest recovery seen in the US Dollar causes the pair to edge lower. The economic calendar will not feature any high-impact data releases.

GBP/USD struggles to gain traction, stabilizes above 1.3450

After testing 1.3400 on the last day of 2025, GBP/USD managed to stage a rebound. Nevertheless, the pair finds it difficult to gather momentum and moves sideways above 1.3450 as market participants remain in holiday mood.

Gold climbs toward $4,400 following deep correction

Gold reverses its direction and advances toward $4,400 after suffering heavy losses amid profit-taking before the New Year holiday. Growing expectations for a dovish Fed policy and persistent geopolitical risks seem to be helping XAU/USD stretch higher.

Cardano gains early New Year momentum, bulls target falling wedge breakout

Cardano kicks off the New Year on a positive note and is extending gains, trading above $0.36 at the time of writing on Friday. Improving on-chain and derivatives data point to growing bullish interest, while the technical outlook keeps an upside breakout in focus.

Economic outlook 2026-2027 in advanced countries: Solidity test

After a year marked by global economic resilience and ending on a note of optimism, 2026 looks promising and could be a year of solid economic performance. In our baseline scenario, we expect most of the supportive factors at work in 2025 to continue to play a role in 2026.

Crypto market outlook for 2026

Year 2025 was volatile, as crypto often is.  Among positive catalysts were favourable regulatory changes in the U.S., rise of Digital Asset Treasuries (DAT), adoption of AI and tokenization of Real-World-Assets (RWA).