Gold Price Forecast: XAU/USD consolidates gains above $4,300
- Gold has been capped at $4,380, but downside attmepopts remain contained above $4,300
- A combination of risk-off markets and US Dollar weakness has sent Gold nearly 8% higher this week.
- Trade war fears and market expectations of further Fed cuts have hammered the US Dollar,

Gold has pulled back on Friday after hitting a fresh all-time high at the $4,380 area, yet with downside attempts contained above $4,300 so far. The precious metal is on track for a nearly 8% rally this week on its best weekly performance in years.
An uncommon combination of risk aversion and a US Dollar weakness has sent precious metals skyrocketing this week. Investors are seeking shelter in traditional safe assets amid the escalating trade tensions between the US and China, while the US shutdown and recurrent signals that the Fed is about to accelerate its easing cycle are undermining confidence in the Greenback.
Technical Analysis: Downside attempts keep finding buyers
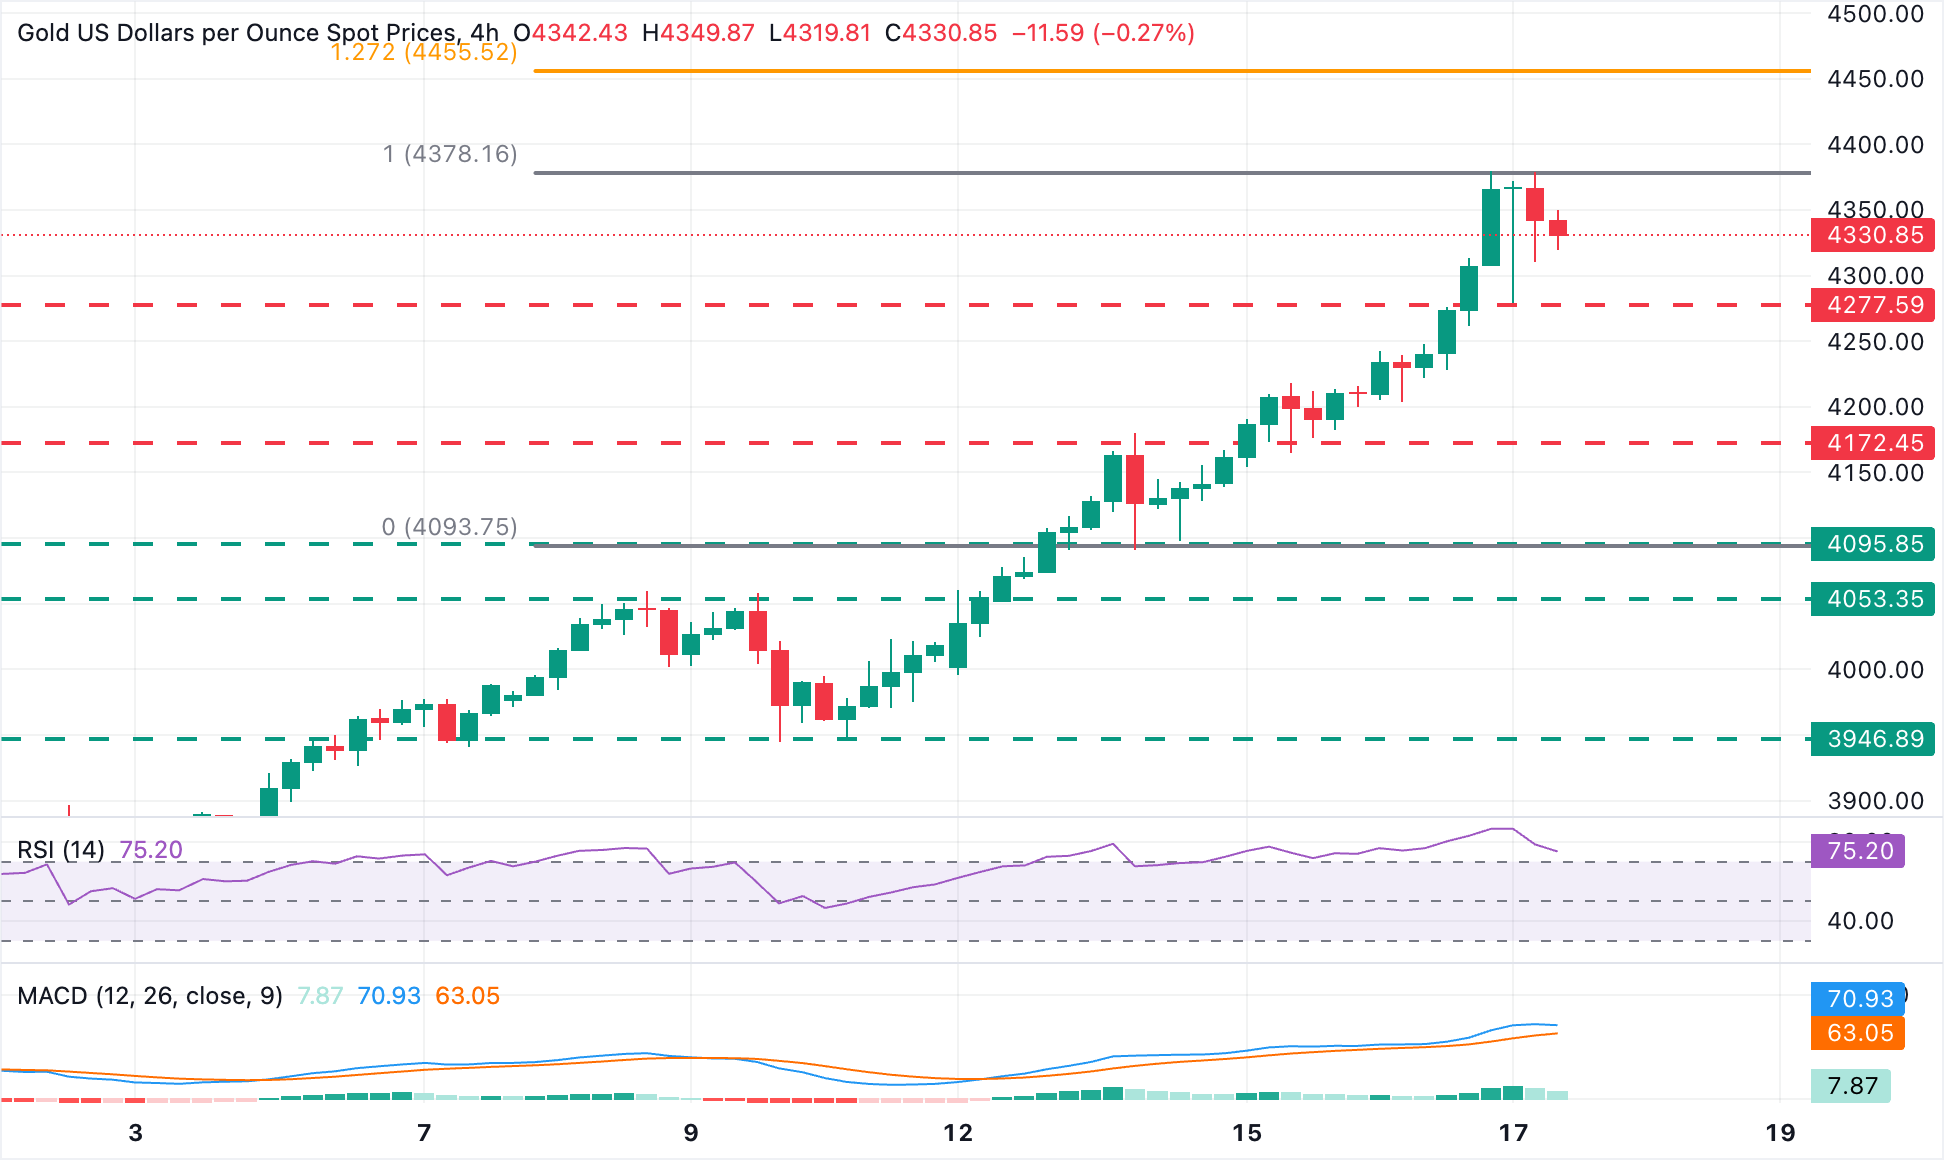
The technical picture shows an extremely overstretched rally. This normally leads to a bearish correction. The risk-off market sentiment and the lower US Treasury yields, however, are keeping Bullion’s downside attempts limited.
So far, the pair is being contained above the $4,300 round level while the intra-day low is at $4,277. A deeper correction might bring the Octoner 14 high, at $4,180, into play.
To the upside, above the mentioned all-time high, at the $4,380 area, the $4,400 psychological level will pose some resistance. Further up, the 127.2% Fibonacci extension of the October 14-16 rally, at $4,455, emerges as a potential target.
Gold FAQs
Gold has played a key role in human’s history as it has been widely used as a store of value and medium of exchange. Currently, apart from its shine and usage for jewelry, the precious metal is widely seen as a safe-haven asset, meaning that it is considered a good investment during turbulent times. Gold is also widely seen as a hedge against inflation and against depreciating currencies as it doesn’t rely on any specific issuer or government.
Central banks are the biggest Gold holders. In their aim to support their currencies in turbulent times, central banks tend to diversify their reserves and buy Gold to improve the perceived strength of the economy and the currency. High Gold reserves can be a source of trust for a country’s solvency. Central banks added 1,136 tonnes of Gold worth around $70 billion to their reserves in 2022, according to data from the World Gold Council. This is the highest yearly purchase since records began. Central banks from emerging economies such as China, India and Turkey are quickly increasing their Gold reserves.
Gold has an inverse correlation with the US Dollar and US Treasuries, which are both major reserve and safe-haven assets. When the Dollar depreciates, Gold tends to rise, enabling investors and central banks to diversify their assets in turbulent times. Gold is also inversely correlated with risk assets. A rally in the stock market tends to weaken Gold price, while sell-offs in riskier markets tend to favor the precious metal.
The price can move due to a wide range of factors. Geopolitical instability or fears of a deep recession can quickly make Gold price escalate due to its safe-haven status. As a yield-less asset, Gold tends to rise with lower interest rates, while higher cost of money usually weighs down on the yellow metal. Still, most moves depend on how the US Dollar (USD) behaves as the asset is priced in dollars (XAU/USD). A strong Dollar tends to keep the price of Gold controlled, whereas a weaker Dollar is likely to push Gold prices up.
Author

Guillermo Alcala
FXStreet
Graduated in Communication Sciences at the Universidad del Pais Vasco and Universiteit van Amsterdam, Guillermo has been working as financial news editor and copywriter in diverse Forex-related firms, like FXStreet and Kantox.


