Gold Price Forecast: XAU/USD clings to gains near $1,770 area, upside seems limited
- Gold is firming at a critical level of support on the daily chart.
- Stagflation risks are being weighed as a driver for gold.
- Oil prices are parabolic and supply chain disruption supports the bullish outlook for gold.

Update: Gold managed to attract some buying on the first day of a new week and recovered a part of Friday's rejection slide from the 100/200-day SMAs confluence hurdle near the $1,800 mark. Currently hovering around the $1,770-71 region, a mixed performance around the equity markets was seen as a key factor that extended some support to the safe-haven XAU/USD. Data released earlier this Monday showed that Chinese economic growth decelerated sharply during the third quarter of 2021. This, along with worries about a faster than expected rise in inflation, fueled fears about the return of stagflation and weighed on investors' sentiment.
The supporting factor, to some extent, was offset by the prospects for an early policy tightening by the Fed. This was evident from elevated US Treasury bond yields, which could act as a headwind for the non-yielding gold. Apart from this, a modest US dollar uptick might further collaborate towards capping gains for the dollar-denominated commodity. The combination of diverging forces warrants some caution for aggressive bullish traders and before positioning for any further appreciating move amid absent relevant US macro releases on Monday.
Previous update: The price of gold on Friday plummetted following signs that the US economy may not be declining at a rate that could spark stagflation in 2022. Data at the end of the week was surprisingly strong in US Retail Sales which, coupled with strong earnings on Wall Street, pressured the remaining bulls on the day to cash in and step aside. XAU/USD fell from a high of $1,796.49 to a low of $1,764.86 on Friday.
At the open of the week, the price is 0.14% higher as bulls look to protect a strategic layer of support, as illustrated below, and trades near $1,770. The high of the day so far has been $1,772 and the lows were $1,764.
The week ahead will have plenty of Federal Reserve speakers, and the Fed’s Beige Book could give further insight into the breadth and depth of bottlenecks facing US industry. Depending on the Fed's rhetoric, gold prices will likely be caught in conflicting sentiment with regards to inflation, stagflation, timings for tapering and final liftoff.
Oil risks are higher still
In this regard, the oil price will be closely monitored which has been at the crux of the recent concerns for stagflation:
-637701131428474499.png)
In the above monthly chart of the world's benchmark for oil prices, Brent, the price is moving parabolic and towards the 2018 highs. They temporarily broke through $85/bbl as the global energy crisis escalates and this spells stagflation risk to the gold markets.
''A tight supply-demand outlook that is particularly fueling upside momentum in Brent crude and heating oil, which can be exacerbated by up to 1 million bpd of incremental winter demand due to natural gas switching for crude and fuel oils,'' analysts at TD Securities explained.
Meanwhile, looking at positioning data, the analysts also noted that ''speculators continued to increase exposure to WTI crude, adding longs and cutting shorts as the ongoing energy crisis remains a substantial risk. With supply risks remaining extremely elevated, OPEC did not offer much to cool the price action.''
''Two-way risks remain elevated,'' the analysts said, ''but the right tail remains the fattest suggesting speculators will be happy to hold on to length in the short-term.''
Arguments against stagflation risks
For the week ahead, it will really be a matter of what side of the argument the markets want to fall on. There are plenty of arguments against stagflation risks brewing just as fast as the arguments for it have risen in recent weeks. For one, analysts at ANZ bank argued that ''activity and price data for September out last week ran counter to the stagflation narrative – there was broad-based strength in retail sales while a range of inflation measures, though still elevated, came in softer than expected.''
Additionally, the analysts noted that ''the Atlanta Fed Wage Growth Tracker, a measure we follow closely, jumped to 4.2% y/y in September up from 3% in May. The increase is largely owing to a sharp rise in wages for low-skilled workers in leisure and hospitality.''
Moreover, the analysts explained that ''President Biden is working with ports on the west coast to ease backlogs. In addition, a number of large logistic and retailing companies are set to expand the use of non-peak hours to ease supply-chain logjams.''
Gold technical analysis
For the latest in-depth technical analysis of gold, see here: Gold Chart of the Week: XAU hit the $1,800 target, now what?
However, at a snapshot, we are likely to see some consolidation to start the week off.
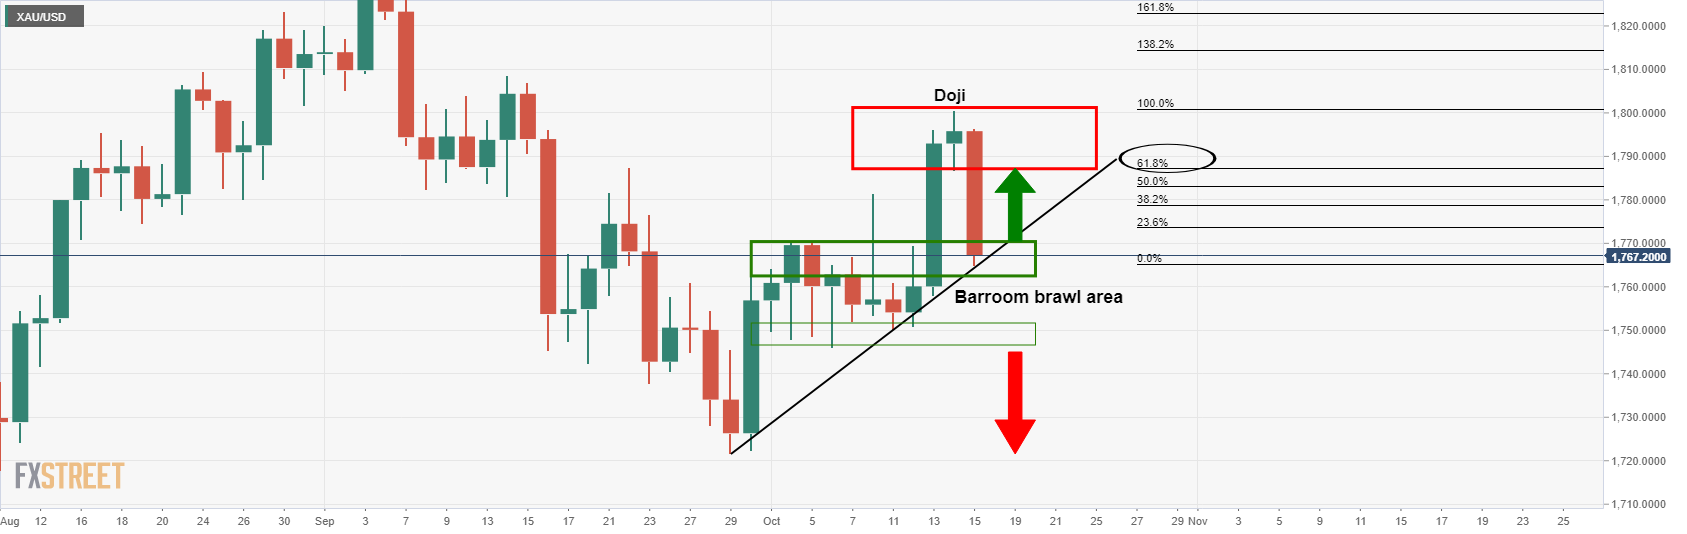
''As illustrated above, the price is testing not only dynamic support but horizontal also. This would be expected to hold initial tests and potentially lead to a restest of the prior day's lows of the Doji candle which has a confluence with the 61.8% Fibonacci retracement level near 1,786.''
''If gold does manage to break the dynamic trendline support, there is still going to be room into the 1,750s where price could find itself stuck in a range, aka, the ''barroom brawl''.
If, on the other hand, the price holds and moves up beyond 1,770 again, that would be bullish.''
Author

Ross J Burland
FXStreet
Ross J Burland, born in England, UK, is a sportsman at heart. He played Rugby and Judo for his county, Kent and the South East of England Rugby team.


