- Gold price struggling to find demand amid a pause in the US Dollar downside.
- Market mood turns cautious while US Treasury yields hover near weekly troughs.
- With the Fed Minutes out of the way, all eyes remain on US employment data.
Gold price is looking to build on the previous rally above $1,850, as bulls gather pace for the next push higher. The bright metal is struggling to find fresh demand, as investors turn cautious and flock to safety in the US Dollar. Meanwhile, the US Treasury bond yields are holding near weekly lows, limiting any downside for Gold buyers. The US Dollar incurred steep losses on Wednesday, as the mixed US ISM Manufacturing PMI data and US Federal Reserve (Fed) Minutes failed to impress. Even though the Fed Minutes showed that the officials are committed to fighting inflation and expect higher interest rates to remain in place, markets continue pricing a dovish Fed pivot by the end of 2023, as recession risks amplify. Attention now turns toward the US employment data, as it will provide further insight into the Fed’s policy path this year.
Also read: XAU/USD outlook: Bulls accelerate on expectations for more dovish Fed
Gold Price: Key levels to watch
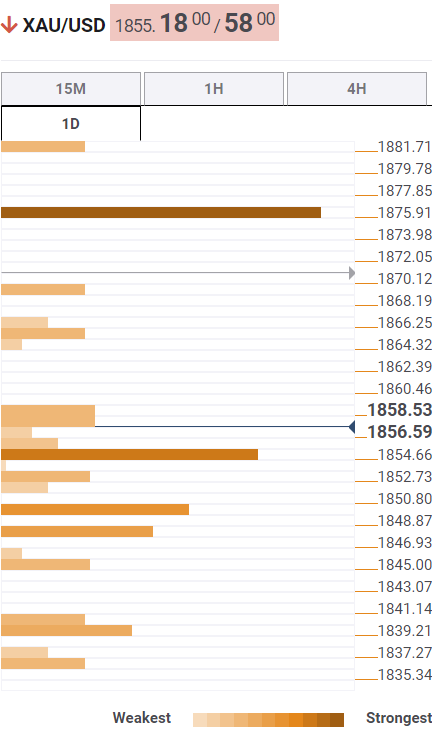
The Technical Confluence Detector shows that the gold price is challenging the bullish commitments at $1,854, which is the convergence of Fibonacci 38.2% one-day and pivot point one-week R2.
A firm break below the latter will call for a test of the pivot point one-month R1 at $1,850. The next immediate support is seen at the Fibonacci 61.8% one-day at $1,847.
The last line of defense for Gold buyers is placed at the Bollinger Band one-day Upper at $1,845.
Alternatively, if buyers regain momentum, then the Fibonacci 23.6% one-day at $1,857 will offer stiff resistance.
The next upside target is envisioned at the $1,860 round number, above which the previous day’s high at $1,865 will be put to test.
Here is how it looks on the tool
About Technical Confluences Detector
The TCD (Technical Confluences Detector) is a tool to locate and point out those price levels where there is a congestion of indicators, moving averages, Fibonacci levels, Pivot Points, etc. If you are a short-term trader, you will find entry points for counter-trend strategies and hunt a few points at a time. If you are a medium-to-long-term trader, this tool will allow you to know in advance the price levels where a medium-to-long-term trend may stop and rest, where to unwind positions, or where to increase your position size.
Information on these pages contains forward-looking statements that involve risks and uncertainties. Markets and instruments profiled on this page are for informational purposes only and should not in any way come across as a recommendation to buy or sell in these assets. You should do your own thorough research before making any investment decisions. FXStreet does not in any way guarantee that this information is free from mistakes, errors, or material misstatements. It also does not guarantee that this information is of a timely nature. Investing in Open Markets involves a great deal of risk, including the loss of all or a portion of your investment, as well as emotional distress. All risks, losses and costs associated with investing, including total loss of principal, are your responsibility. The views and opinions expressed in this article are those of the authors and do not necessarily reflect the official policy or position of FXStreet nor its advertisers. The author will not be held responsible for information that is found at the end of links posted on this page.
If not otherwise explicitly mentioned in the body of the article, at the time of writing, the author has no position in any stock mentioned in this article and no business relationship with any company mentioned. The author has not received compensation for writing this article, other than from FXStreet.
FXStreet and the author do not provide personalized recommendations. The author makes no representations as to the accuracy, completeness, or suitability of this information. FXStreet and the author will not be liable for any errors, omissions or any losses, injuries or damages arising from this information and its display or use. Errors and omissions excepted.
The author and FXStreet are not registered investment advisors and nothing in this article is intended to be investment advice.
Recommended content
Editors’ Picks
USD/JPY holds positive ground around 151.50 following Japanese CPI data
The USD/JPY pair holds positive ground for the second consecutive day near 151.45 on Friday during the early Asian trading hours. The cautious approach from the Bank of Japan to keep monetary conditions accommodative exerts some selling pressure on the Japanese Yen.
AUD/USD holds above 0.6500 in thin trading
The Australian Dollar managed to recover ground against its American rival after AUD/USD fell to 0.6484. The upbeat tone of Wall Street underpinned the Aussie despite broad US Dollar strength and tepid Australian data.
Gold price finishes Thursday’s session set to reach new all-time highs
Gold price rallied during the North American session on Thursday and hit a new all-time high of $2,225 in the mid-North American session. Precious metal prices are trending higher even though US Treasury yields are advancing, underpinning the Greenback.
Top 3 Price Prediction BTC, ETH, XRP: Retail watches from the sidelines with a bias for shorts
Bitcoin is showing strength as markets head into the Easter holidays. As it rises, altcoins are following suit, with Ethereum and Ripple posting almost similar gains. Meanwhile, there remains an unfilled CME Gap, with a lot of liquidity also resting above and below BTC price.
Bears have been standing before a steamroller so far this year
Despite a pushback on rate cuts from Christopher Waller, and what was supposed to be cautious trading sentiment ahead of critical US inflation data released later on Friday, the S&P 500 rose on Thursday, marking its best first-quarter performance in five years.