Gold Price Forecast: XAU/USD off weekly highs near $1,825 as Treasury yields rally
- Gold buyers retain control following the biggest daily gains in three weeks.
- Sustained trading beyond 200-DMA joins RSI, MACD conditions to keep buyers hopeful.
- Market’s cautious optimism helps gold buyers amid light calendar ahead of US CPI, trade, geopolitics can entertain short-term traders.
- Gold Price Forecast: Bulls in the driver’s seat, eyeing $1,825.60

Update: Gold price is easing off weekly highs above $1,820, as the US dollar rebound gathers steam amid the renewed upside in the Treasury yields across the curve. The benchmark 10-year rates hit 1.95%, the highest level since December 2019, as markets continue to price in aggressive Fed rate hike to tame soaring inflation. The greenback is also gaining ground across the board amid resurfacing US-China trade concerns and the impending Russia-Ukraine crisis, which fuels risk-off market sentiment. Investors also remain worried over rising price pressures ahead of Thursday’s US inflation data. In the meantime, the Fed sentiment will continue to affect the dollar valuations, in turn, influencing gold price.
Read: Gold Price Forecast: XAU/USD bulls have the upper hand, $1,810 confluence holds the key
Gold (XAU/USD) grinds higher during the three-day uptrend, poking the previous support around $1,820 during Tuesday’s Asian session.
The yellow metal jumped the most since late January the previous day as downbeat prints of US inflation expectations, portrayed by the 10-year breakeven inflation rate per the St. Louis Federal Reserve (FRED) data, challenge the hawkish Fed concerns.
Also recently underpinning the gold’s upside momentum are the receding fears surrounding the imminent Russia-Ukraine war and optimism concerning the US-Japan steel trades.
However, worsening covid woes in Japan and Hong Kong, not to forget the US-China trade tussles, challenge the market optimism.
“Hong Kong Chief Executive Carrie Lam is set to discuss further restrictions at an Executive Council meeting on Tuesday after a record number of new coronavirus infections were reported, with cases doubling every three days,” said Bloomberg. On the other hand, Japan’s Tokyo is up for extending the virus-led quasi-emergency towards early March amid record daily infections.
Against this backdrop, the US 10-year Treasury yields added two basis points to 1.936%, close to the highest levels since late 2020, while the US stock future print mild gains around 4,485 at the latest. That said, the benchmark US T-bond coupons eased from a two-year high the previous day while Wall Street marked sluggish closing.
Additionally, stocks in the Asia-Pacific region also grind higher to portray slightly positive market sentiment while the US Dollar Index (DXY) struggles around a multi-day low as traders await clear signals on the Fed’s next move.
While the US inflation data will be crucial for the short-term gold moves, today’s US Goods and Services Trade Balance for December, expected $-83B versus $-80.2B, can offer intraday directions. However, major attention will be given to risk catalysts.
Read: Do not expect volatility to ease as US CPI is due this week
Technical analysis
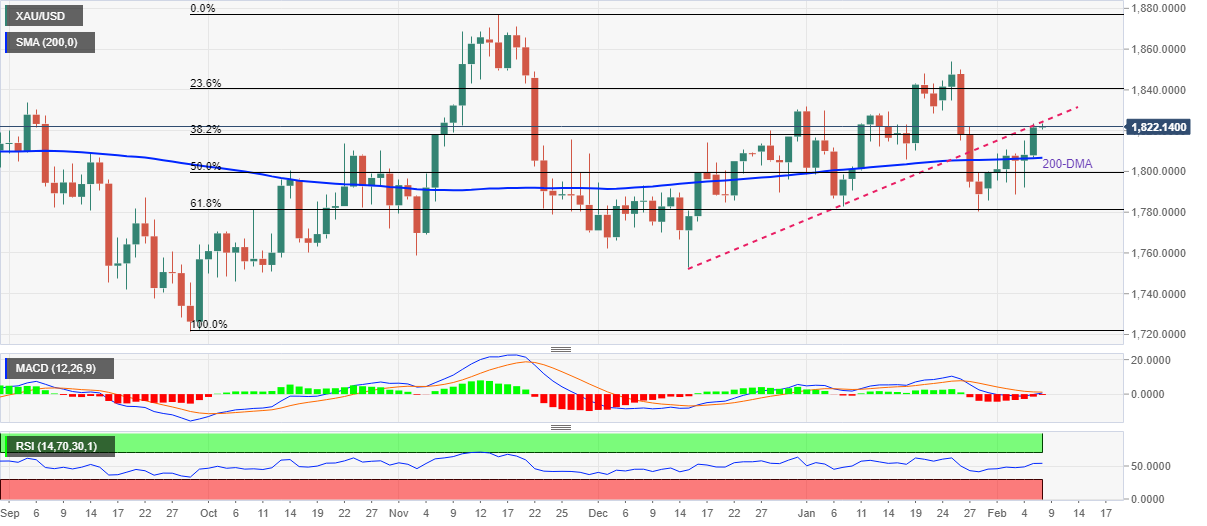
Gold extends late January’s rebound from 61.8% Fibonacci retracement (Fibo.) of September-November 2021 upside to regain its place above the 200-DMA.
As the receding bearish bias of MACD and gradually improving RSI line back the bullion’s run-up beyond the 200-DMA, a support-turned-resistance line from December 15, 2021, near $1,825, challenges immediate upside.
Also acting as the key short-term upside hurdle is a five-week-old horizontal area between $1,828-32, a break of which will give the command to gold buyers aiming for a fresh 2022 peak, beyond the latest $1,853.
Alternatively, the 200-DMA level of $1,806 and the $1,800 threshold may test short-term pullbacks of gold prices.
Following that, the 61.8% and 78.6% Fibo. levels near $1,780 and $1,753 respectively will lure the bears.
However, a clear downside past $1,753 won’t hesitate to challenge September 2021 low near $1,721.
Gold: Daily chart
Trend: Further recovery expected
Author

Anil Panchal
FXStreet
Anil Panchal has nearly 15 years of experience in tracking financial markets. With a keen interest in macroeconomics, Anil aptly tracks global news/updates and stays well-informed about the global financial moves and their implications.


