|

Gold Price Forecast: XAU/USD advances sligtly as the USD weakens and yields decline

  • XAU/USD advanced slightly to $1,985, seeing 0.15% gains.
  • Short-term US Treasury yields are weak, near monthly lows.
  • Eyes on Friday's Nonfarm Payrolls.  
Gold Price Forecast: XAU/USD advances sligtly as the USD weakens and yields decline

In Thursday's session, the XAU/USD Gold Spot price gained limited momentum, jumping to $1,985, benefited by lower US yields and a weaker US Dollar following Wednesday's Federal Reserve (Fed) decision. 

Markets are confident that the Fed is approaching the end of its tightening cycle after Chair Powell highlighted that the bank covered significant ground and that for the next decisions, it will consider the tighter financial conditions and the cumulative effects of the tightening. As a reaction, US yields, often seen as the opportunity cost of holding Gold, sharply declined, which allowed the metal to gain some ground with the 2,5 and 10-year rates standing near monthly lows at 4.99%,4.64% and 4.66%. In addition, the hawkish bets on the Fed from December declined, with the swaps markets discounting only 20% chances of a 25 basis point hike which also added to the Greenback's weakness.

That being said, the US will report October's Nonfarm Payrolls on Friday, which are expected to follow last month's tendency, showing a decelerating job creation. Average Hourly Earnings are also seen decelerating while the Unemployment rate is forecasted to remain steady at 3.8%. It is worth noticing that a hot reading may revive the hawkish bets on the Fed as despite welcoming the recent data which showed a cooling in the sector, the bank clarified that it is ready to adjust further in case needed.

XAU/USD Levels to watch


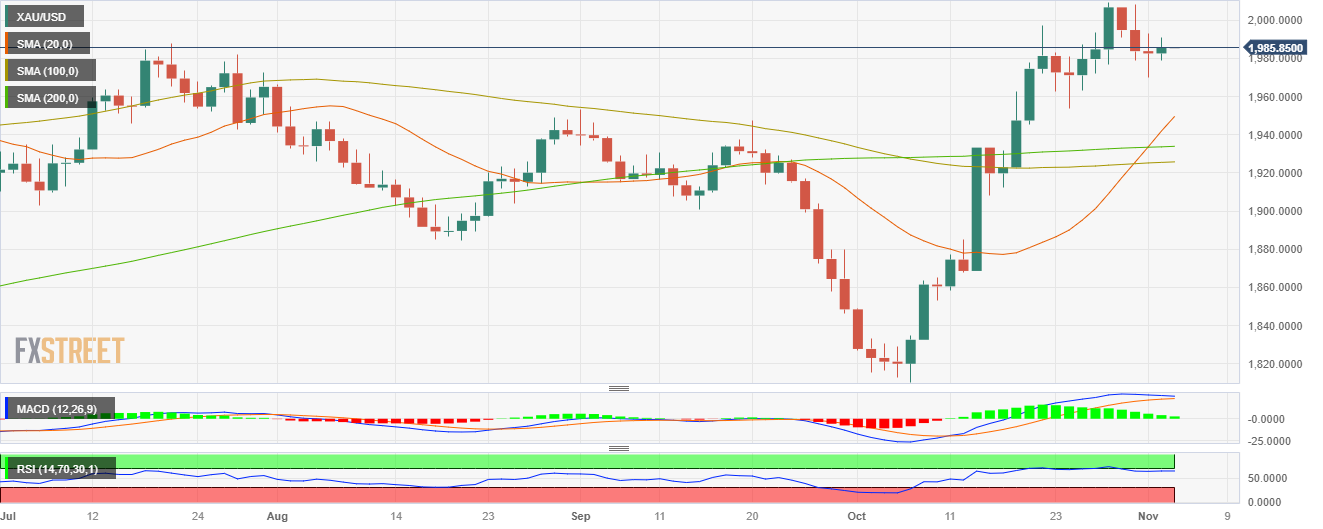
The technical analysis of the daily chart points to a neutral to bullish outlook for XAU/USD, indicating a decline in bullish strength as the metal seems to be correcting overbought conditions after hitting $2,000 last week.

With a flat slope above its midline, the Relative Strength Index (RSI) suggests a period of stability in positive territory, while the Moving Average Convergence (MACD) displays weaker green bars. Furthermore, the pair is above the 20,100,200-day Simple Moving Average (SMAs), suggesting that the bears are struggling to challenge the overall bullish trend.  

Support levels: $1,970, $1,950, $1,930.

Resistance levels: $2,000,$2,015, $2,030.

XAU/USD Daily chart
XAU/USD

Overview
Today last price1985.85
Today Daily Change3.29
Today Daily Change %0.17
Today daily open1982.56
 
Trends
Daily SMA201933.65
Daily SMA501918.03
Daily SMA1001925.22
Daily SMA2001933.45
 
Levels
Previous Daily High1992.89
Previous Daily Low1969.9
Previous Weekly High2009.49
Previous Weekly Low1953.61
Previous Monthly High2009.49
Previous Monthly Low1810.51
Daily Fibonacci 38.2%1978.68
Daily Fibonacci 61.8%1984.11
Daily Pivot Point S11970.68
Daily Pivot Point S21958.79
Daily Pivot Point S31947.69
Daily Pivot Point R11993.67
Daily Pivot Point R22004.77
Daily Pivot Point R32016.66

Author

Patricio Martín

Patricio is an economist from Argentina passionate about global finance and understanding the daily movements of the markets.


More from Patricio Martín
Share:

Editor's Picks

AUD/USD bears retain control near YTD low, 0.6650 tested

AUD/USD sits at fresh YTD lows near 0.6550 in Friday's Asian session and looks vulnerable to further downside. The US Dollar holds near April 2025 highs amid renewed US-Iran tensions and aggressive Fed rate-hike bets. Moreover, Thursday’s dismal Aussie jobs data, the RBA’s dovish tilt and PBOC's status-quo continue to weigh on the Aussie, validating the negative outlook for the currency pair.

USD/JPY drops below 159.50 after Japan’s National CPI

USD/JPY has turned south below mid-159.00s in the Asian session on Friday, as the Japanese Yen gains ground following the country's National CPI, which reaffirmed the December BoJ rate hike. Further, a broader risk-off market environment lifts the Yen's safe-haven appeal. However, hawkish Fed outlook and renewed US-Iran tensions keep the US Dollar supported, which could limit the pair's downside.


Gold: The $3,500 zone holds the downside… for now

Gold further extends its deep pullback, coming close to the key $3,500 mark per troy ounce as Friday’s European session draws to a close. Furthermore, the yellow metal has traded with losses since Monday, always tracking rising bets for extra tightening by the Fed and the lack of any progress from the Middle East conflict.

Bitcoin slips below $60,000 as selling pressure accelerates

Bitcoin price slips below $60,000 on Friday, reaching a level not seen since early July. Momentum indicators suggest firm selling pressure despite reaching oversold levels.

Week ahead – Flash PMIs and PCE inflation in focus ahead of Thanksgiving

US flash PMIs and PCE inflation data could shape Fed rate expectations. Eurozone and UK PMIs will offer an early look at business activity. Australia’s CPI data could influence expectations for the RBA’s next move.

Gold's 14-month low looks mild next to Silver's fall from $121 to $44
Gold has lost a third of its value since January as traders bet on more Federal Reserve rate increases. Silver has lost nearly two-thirds, because the buyers still holding Gold up have no equivalent in the Silver market. Gold is trading below $3,700 for the first time since September 2025, a little more than a third under the record near $5,600 it set in late January.















