Gold Price Forecast: Battle lines well-mapped for XAU/USD ahead of US data – Confluence Detector
- Gold price returns to the red amid risk-on sentiment.
- Treasry yields hold higher while the USD bounce fizzles amid better mood.
- Gold could target $1,830 next ahead of NFP.

Fed Chair Jerome Powell-led optimism extends into Wednesday, limiting the upside attempts in gold price. The market mood remains upbeat, as investors shrug off global growth worries amidst expectations of more stimulus from China. The US Treasury yields are holding onto the recent rebound, weighing negatively on gold price. However, the US dollar fades its recovery momentum ahead of the critical US jobs data, cushioning the downside in gold. The mixed catalysts are likely to keep gold price wavering in a familiar range above $1800, as all eyes remain on Friday’s NFP report.
Read: Gold Price Forecast: XAU/USD eyes acceptance above $1817 for further upside, US ADP, ISM in focus
Gold Price: Key levels to watch
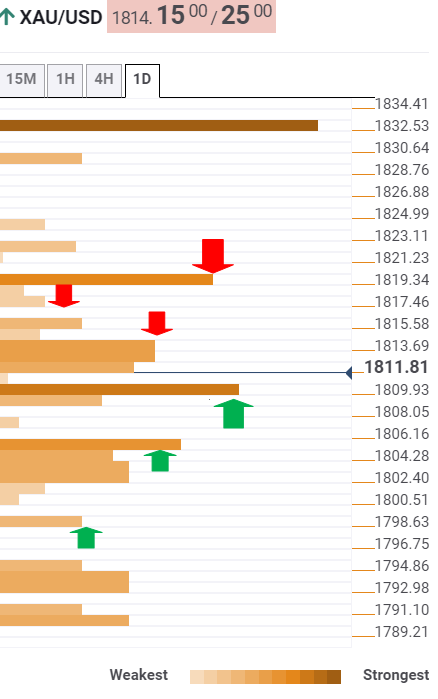
The Technical Confluences Detector shows that gold price is being challenged by a bunch of healthy support and resistance levels, as it nears the key event risk of the week.
Gold failed to hold at higher levels, now battling a dense cluster of resistance levels around $1814, which is the confluence of the Fibonacci 38.2% one-day, the previous low four-hour and SMA10 four-hour.
Recapturing the latter could revive the bullish momentum towards $1817, the Fibonacci 23.6% one-day.
Further up, the previous week and day’s high at $1820 is the level to beat for gold bulls.
On the flip side, the intersection of the Fibonacci 23.6% one-week and SMA200 one-day around $1810 offer strong support.
Sellers will then aim for the cushion around $1805, where the SMA5 one-day, pivot point one-day S1 and Fibonacci 38.2% one-week coincide.
The last line of defense for gold buyers is the SMA10 one-day at $1798.
Here is how it looks on the tool
About Technical Confluences Detector
The TCD (Technical Confluences Detector) is a tool to locate and point out those price levels where there is a congestion of indicators, moving averages, Fibonacci levels, Pivot Points, etc. If you are a short-term trader, you will find entry points for counter-trend strategies and hunt a few points at a time. If you are a medium-to-long-term trader, this tool will allow you to know in advance the price levels where a medium-to-long-term trend may stop and rest, where to unwind positions, or where to increase your position size.
Author

Dhwani Mehta
FXStreet
Residing in Mumbai (India), Dhwani is a Senior Analyst and Manager of the Asian session at FXStreet. She has over 10 years of experience in analyzing and covering the global financial markets, with specialization in Forex and commodities markets.


