Gold Price Forecast: Battle lines well-defined below $1800 – Confluence Detector
- Gold wavers in a narrow range, digesting dovish Powell’s comments.
- US dollar reverses early gains, despite worsening market mood.
- Gold Weekly Forecast: XAU/USD poised to extend slide after breaking key supports

Gold price is trading back and forth in a narrow trading range, recovering a part of Tuesday’s decline. Despite Fed Chair Jerome Powell’s dovish take on the monetary policy, gold price is unable to find an impetus to extend the rebound. An uptick in the US Treasury yields appears to be capping the recovery gains in gold, as the bull-bear tug-of-war extends. The return of the risk-off sentiment coupled with the US dollar’s latest leg down cushions gold’s downside. Investors reassess last week’s hawkish Fed surprise, as Powell downplays inflation concerns ahead of Friday’s all-important PCE inflation release.
Read: Markets search for direction ahead of Powell testimony
Gold Price: Key levels to watch
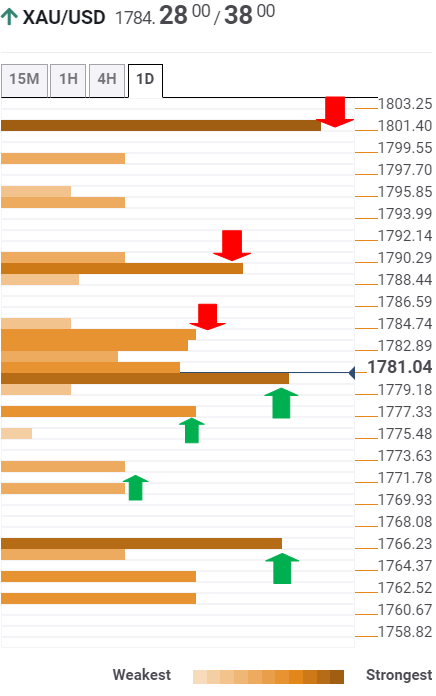
The Technical Confluences Detector shows that gold price is eyeing a sustained move below p0owerful support at $1779, where the Fibonacci 38.2% one-day coincides with the Bollinger Band 4H Middle.
Sellers will then aim for the confluence of the Fibonacci 23.6% one-day and previous low on four-hour at $1776.
The next relevant support awaits around the $1770 region, the meeting point of the previous day’s low and pivot point one-day S1.
Gold bears need to crack the previous month’s low of $1766, in order to unleash additional downside.
Alternatively, gold bulls must clear a dense cluster of healthy resistance levels stacked up around $1784, which is the convergence of the Fibonacci 61.8% one-day, Bollinger Band one-hour Upper and the previous high four-hour.
Fierce resistance at $1790 is likely to challenge the bullish commitments. At that level, the Fibonacci 23.6% one-wee intersects with the previous day’s high.
The last critical barrier for the bulls is seen at the SMA100 one-day at $1794.
Here is how it looks on the tool
About Technical Confluences Detector
The TCD (Technical Confluences Detector) is a tool to locate and point out those price levels where there is a congestion of indicators, moving averages, Fibonacci levels, Pivot Points, etc. If you are a short-term trader, you will find entry points for counter-trend strategies and hunt a few points at a time. If you are a medium-to-long-term trader, this tool will allow you to know in advance the price levels where a medium-to-long-term trend may stop and rest, where to unwind positions, or where to increase your position size.
Author

Dhwani Mehta
FXStreet
Residing in Mumbai (India), Dhwani is a Senior Analyst and Manager of the Asian session at FXStreet. She has over 10 years of experience in analyzing and covering the global financial markets, with specialization in Forex and commodities markets.