Gold Price Forecast: At the mercy of Russia-Ukraine news, key levels to watch – Confluence Detector
- Gold price remains choppy below $1,950, lacking a clear directional bias.
- The Russia-Ukraine updates affect the risk sentiment, gold price action.
- Will gold recapture $1,950 on Russia-Ukraine peace talks 2.0, Powell?

Gold price appears choppy but within a familiar range above the $1,900 mark, as the prevalent risk sentiment remains the main market driver amid incoming updates surrounding the Russia-Ukraine war. Uncertainty over the timing of another round of peace talks, soaring oil prices and global growth worries continue to sap investors’ confidence, diverting the safe-haven flows into the US dollar. Gold traders brace for the US Employment data and Fed Chair Jerome Powell’s testimony for fresh trading opportunities.
Read: Powell Preview: Rethink because of the war? Not so fast, Fed set to remain on track, dollar to rise
Gold Price: Key levels to watch
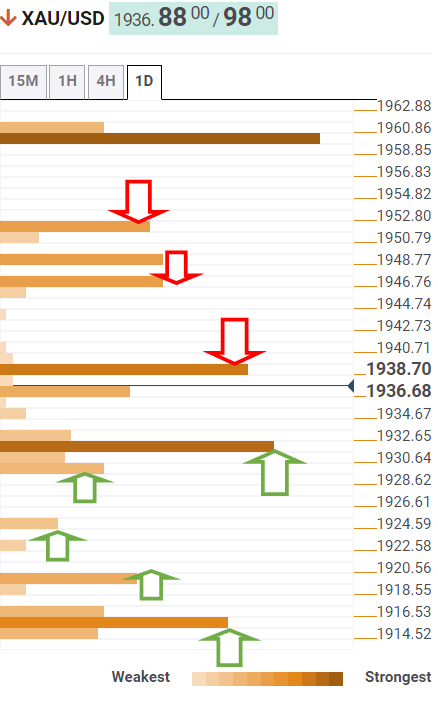
The Technical Confluences Detector shows that gold price has found solid support at $1,931, which is the intersection of the Fibonacci 23.6% one-month and the previous low four-hour.
If the latter gives way on selling resurgence, then the Fibonacci 38.2% one-day at $1,928 could come to the immediate rescue of gold bulls.
The additional declines will call for a test of the SMA10 four-hour at $1,924, below which the Fibonacci 61.8% one-day at $1,919 will help limit the downside.
The level to beat for gold bears is seen at $1,916, where the Fibonacci 38.2% one-week coincides with the pivot point one-day S1.
On the upside, strong resistance is aligned at $1,936, which is Fibonacci 23.6% one-day.
Gold bulls need a sustained break above $1,939 (confluence of the Fibonacci 61.8% one-week, and SMA5 four-hour) to resume the upside towards the $1,950 level.
Ahead of that psychological barrier, the previous day’s high of $1,946 could be tested.
Here is how it looks on the tool
About Technical Confluences Detector
The TCD (Technical Confluences Detector) is a tool to locate and point out those price levels where there is a congestion of indicators, moving averages, Fibonacci levels, Pivot Points, etc. If you are a short-term trader, you will find entry points for counter-trend strategies and hunt a few points at a time. If you are a medium-to-long-term trader, this tool will allow you to know in advance the price levels where a medium-to-long-term trend may stop and rest, where to unwind positions, or where to increase your position size.
Author

Dhwani Mehta
FXStreet
Residing in Mumbai (India), Dhwani is a Senior Analyst and Manager of the Asian session at FXStreet. She has over 10 years of experience in analyzing and covering the global financial markets, with specialization in Forex and commodities markets.


