- Gold price consolidates the upside, with stiff resistance seen at $1,870.
- Weaker Treasury yields underpin but global tightening bets limit gold bulls.
- Gold capitalizes on inflation fears, buyers look to retain control.
Gold price is struggling to extend the upside beyond the critical $1,870 supply zone, despite the extended weakness in the US Treasury yields and the dollar. Increased calls for the global central banks to act to tackle inflation are limiting gold’s bullish momentum. Although, gold bulls continue to benefit from the persistent worries and the recent retreat in the US rates from three-week highs. Fed speculation and inflation concerns will continue to drive the sentiment around the yields and gold price.
Read: Gold Price Forecast: Falling yields could fuel a sustained break above $1,878 in XAU/USD
Gold Price: Key levels to watch
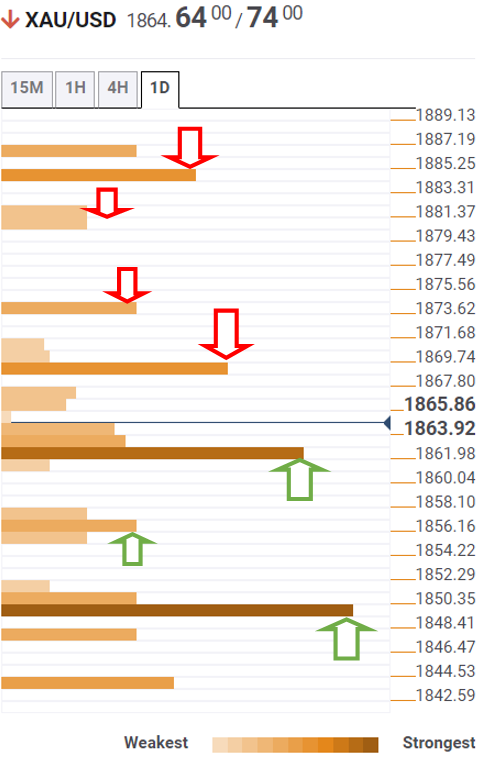
The Technical Confluences Detector shows that gold price is wavering below the critical topside hurdle of $1,870, which is the meeting point of the previous week’s high and the previous day’s high.
Acceptance above the latter will kick start a fresh advance towards $1,880, where the pivot point one-day R2 lies.
Ahead of that the confluence of the pivot point one-day R1 and Bollinger Band four-hour Upper at $1,873 will guard the upside.
If the bulls flex their muscles, then the pivot point one-month R3 at $1,884 will get tested.
Alternatively, sellers need a strong foothold below $1,862, the convergence of the Fibonacci 38.2% one-day and SMA5 one-day, to take over complete control.
The next critical cushion is seen at $1,857, the intersection of the Fibonacci 61.8% one-day and Fibonacci 23.6% one-week.
The pivot point one-month R2 at $1,850 is the last line of defense for gold optimists.
Here is how it looks on the tool
About Technical Confluences Detector
The TCD (Technical Confluences Detector) is a tool to locate and point out those price levels where there is a congestion of indicators, moving averages, Fibonacci levels, Pivot Points, etc. If you are a short-term trader, you will find entry points for counter-trend strategies and hunt a few points at a time. If you are a medium-to-long-term trader, this tool will allow you to know in advance the price levels where a medium-to-long-term trend may stop and rest, where to unwind positions, or where to increase your position size.
Information on these pages contains forward-looking statements that involve risks and uncertainties. Markets and instruments profiled on this page are for informational purposes only and should not in any way come across as a recommendation to buy or sell in these assets. You should do your own thorough research before making any investment decisions. FXStreet does not in any way guarantee that this information is free from mistakes, errors, or material misstatements. It also does not guarantee that this information is of a timely nature. Investing in Open Markets involves a great deal of risk, including the loss of all or a portion of your investment, as well as emotional distress. All risks, losses and costs associated with investing, including total loss of principal, are your responsibility. The views and opinions expressed in this article are those of the authors and do not necessarily reflect the official policy or position of FXStreet nor its advertisers. The author will not be held responsible for information that is found at the end of links posted on this page.
If not otherwise explicitly mentioned in the body of the article, at the time of writing, the author has no position in any stock mentioned in this article and no business relationship with any company mentioned. The author has not received compensation for writing this article, other than from FXStreet.
FXStreet and the author do not provide personalized recommendations. The author makes no representations as to the accuracy, completeness, or suitability of this information. FXStreet and the author will not be liable for any errors, omissions or any losses, injuries or damages arising from this information and its display or use. Errors and omissions excepted.
The author and FXStreet are not registered investment advisors and nothing in this article is intended to be investment advice.
Recommended content
Editors’ Picks
USD/JPY holds positive ground around 151.50 following Japanese CPI data
The USD/JPY pair holds positive ground for the second consecutive day near 151.45 on Friday during the early Asian trading hours. The cautious approach from the Bank of Japan to keep monetary conditions accommodative exerts some selling pressure on the Japanese Yen.
AUD/USD holds above 0.6500 in thin trading
The Australian Dollar managed to recover ground against its American rival after AUD/USD fell to 0.6484. The upbeat tone of Wall Street underpinned the Aussie despite broad US Dollar strength and tepid Australian data.
Gold price finishes Thursday’s session set to reach new all-time highs
Gold price rallied during the North American session on Thursday and hit a new all-time high of $2,225 in the mid-North American session. Precious metal prices are trending higher even though US Treasury yields are advancing, underpinning the Greenback.
Bitcoin price extends retreat from $69K as old whales shift their holdings to new whales
Bitcoin price continues to move further away from the $69,000 threshold, gaining ground as BTC bulls hope for a retest of the $73,777 peak. This is because of the general assumption that clearing this blockade would set the tone for a reach higher, marking a new all-time high.
Bears have been standing before a steamroller so far this year
Despite a pushback on rate cuts from Christopher Waller, and what was supposed to be cautious trading sentiment ahead of critical US inflation data released later on Friday, the S&P 500 rose on Thursday, marking its best first-quarter performance in five years.