Gold Weekly Forecast: XAU/USD capitalizes on inflation fears, buyers look to retain control
- Gold rose more than 2% and closed its second straight week higher.
- Rising US T-bond yields and broad dollar strength could limit XAU/USD's upside.
- Bullish outlook should stay intact if gold clears key resistance area.

After closing the previous week on a firm footing, gold continued to edge higher on Monday and Tuesday but lost its bullish momentum near $1,830. With data from the US showing that consumer inflation reached its highest level since 1990, XAU/USD regained traction and touched its highest level since June at $1,868 on Wednesday. Although gold retreated from that level, it managed to close in the positive territory on Wednesday and Thursday before going into a consolidation phase on Friday. For the week, the pair rose more than 2%.
What happened last week
The benchmark 10-year US Treasury bond yield broke below 1.5% on Monday and lost more than 3% on a daily basis, allowing gold to push higher at the start of the week. In the absence of high-tier macroeconomic data releases, varying commentary on the Federal Reserve’s policy outlook caused the dollar to lose some interest. St. Louis Federal Reserve President James Bullard told Fox Business Network that he was expected to see two rate hikes in 2022 but Vice Chair Richard Clarida argued that benchmarks for rate hikes could be met by the end of next year.
On Tuesday, the data from the US showed that the Producer Price Index (PPI) stayed unchanged at 8.6% on a yearly basis in October. This reading came in below the market expectation of 8.7% but failed to trigger a noticeable market reaction and the modest dollar weakness allowed gold to remain in positive territory.
The US Bureau of Labor Statistics reported on Wednesday that annual inflation, as measured by the Consumer Price Index (CPI), jumped to its highest level since 1990 at 6.2% in October. The Core CPI, which excludes volatile food and energy prices, also climbed to its strongest level in more than three decades at 4.6%. This print caused investors to start pricing a sooner-than-expected rate hike and US Treasury bond yields shot higher. Nevertheless, the inverse correlation between the precious metal and US T-bond yields weakened with gold finding strong demand as a traditional inflation hedge.
Additionally, bullish momentum gathered strength with the failure of the key resistance area at $1,830 and XAU/USD advanced to a five-month top near $1,870.
Trading action remained subdued due to the Veterans Day holiday on Thursday and gold didn’t have a difficult time clinging to its daily gains. The 10-year T-bond yield opened with a bullish gap on Friday and profit-taking ahead of the weekend forced gold to stage a correction. According to the CME Group’s FedWatch Tool, markets are currently pricing a more-than-70% chance of a Fed rate hike by June 2022.
On Friday, the University of Michigan announced that the Consumer Sentiment Index fell to its lowest level since November 2011 at 66.8. "One-in-four consumers cited inflationary reductions in their living standards in November, with lower income and older consumers voicing the greatest impact," the publication read.
Next week
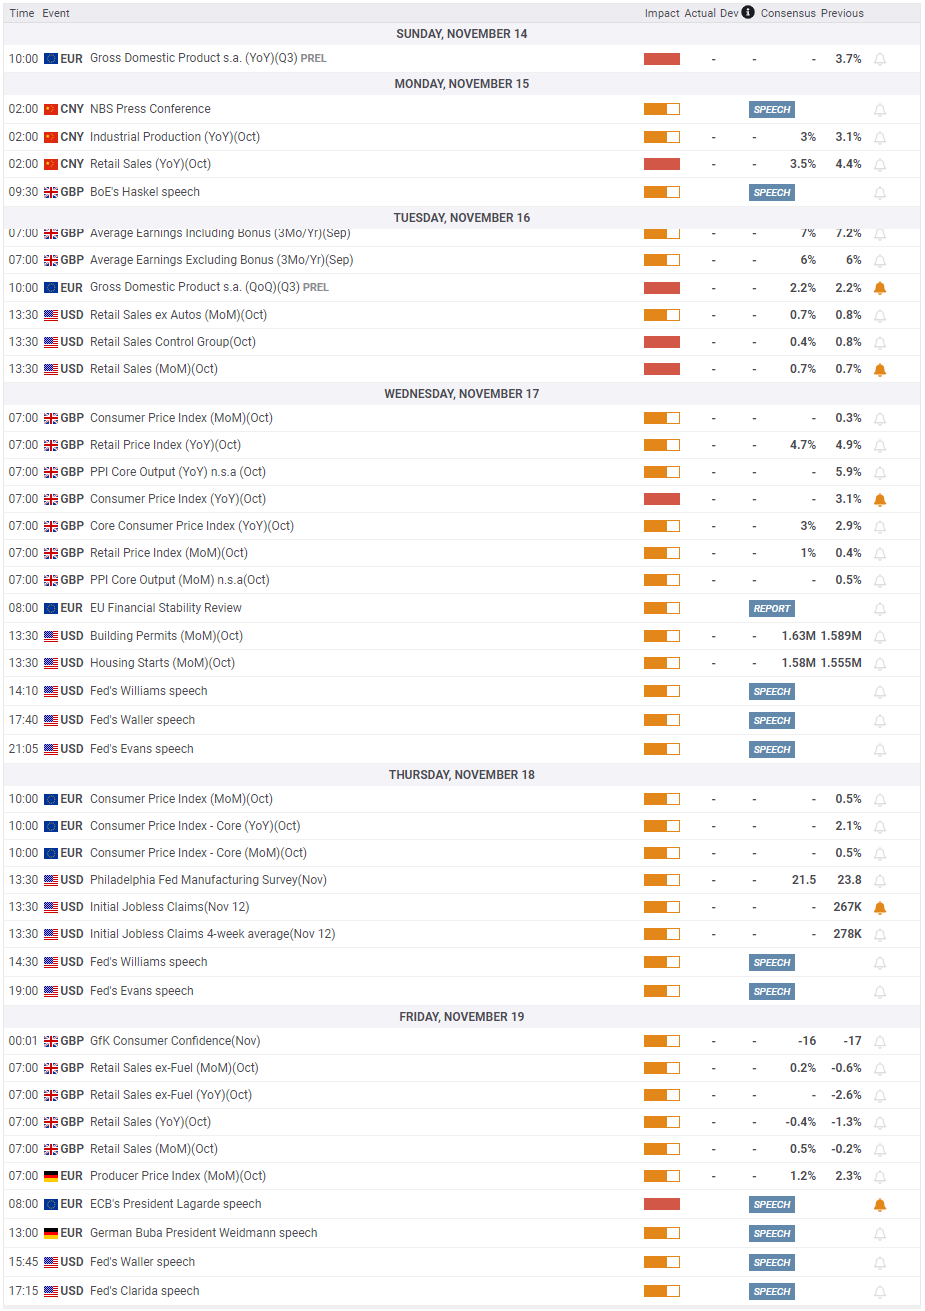
On Monday, Retail Sales and Industrial Production data from China are expected to show further loss of momentum in the world’s second-biggest economy. In case the market mood sours at the start of the week, gold is likely to continue to find demand.
On Tuesday, the US Census Bureau will publish the October Retail Sales data. A weaker-than-expected print could revive concerns over inflation impacting consumer activity negatively and provide a boost to gold. On the other hand, an upbeat reading could help risk flows return to markets and limit XAU/USD’s upside.
CPI data from the UK and the euro area on Wednesday and Thursday, respectively, will be looked upon for fresh impetus. Even though the data from Europe don’t usually have a noticeable effect on gold’s market valuation, they could highlight the policy divergence and weigh on XAU/USD by lifting the dollar against other major currencies. In case the CPI figures reveal that price pressures are stronger than expected, gold could stay resilient vs the greenback.
In summary, market participants will remain focused on inflation and what it means for major central banks’ policy outlook in the near term. Comments from FOMC policymakers will be key in determining whether the Fed will prioritize controlling inflation over supporting the economy. Gold should keep its status as a desired asset in the face of undesired inflation but unabated dollar strength is likely to allow XAU/EUR and XAU/GBP to outperform XAU/USD.
Gold technical outlook
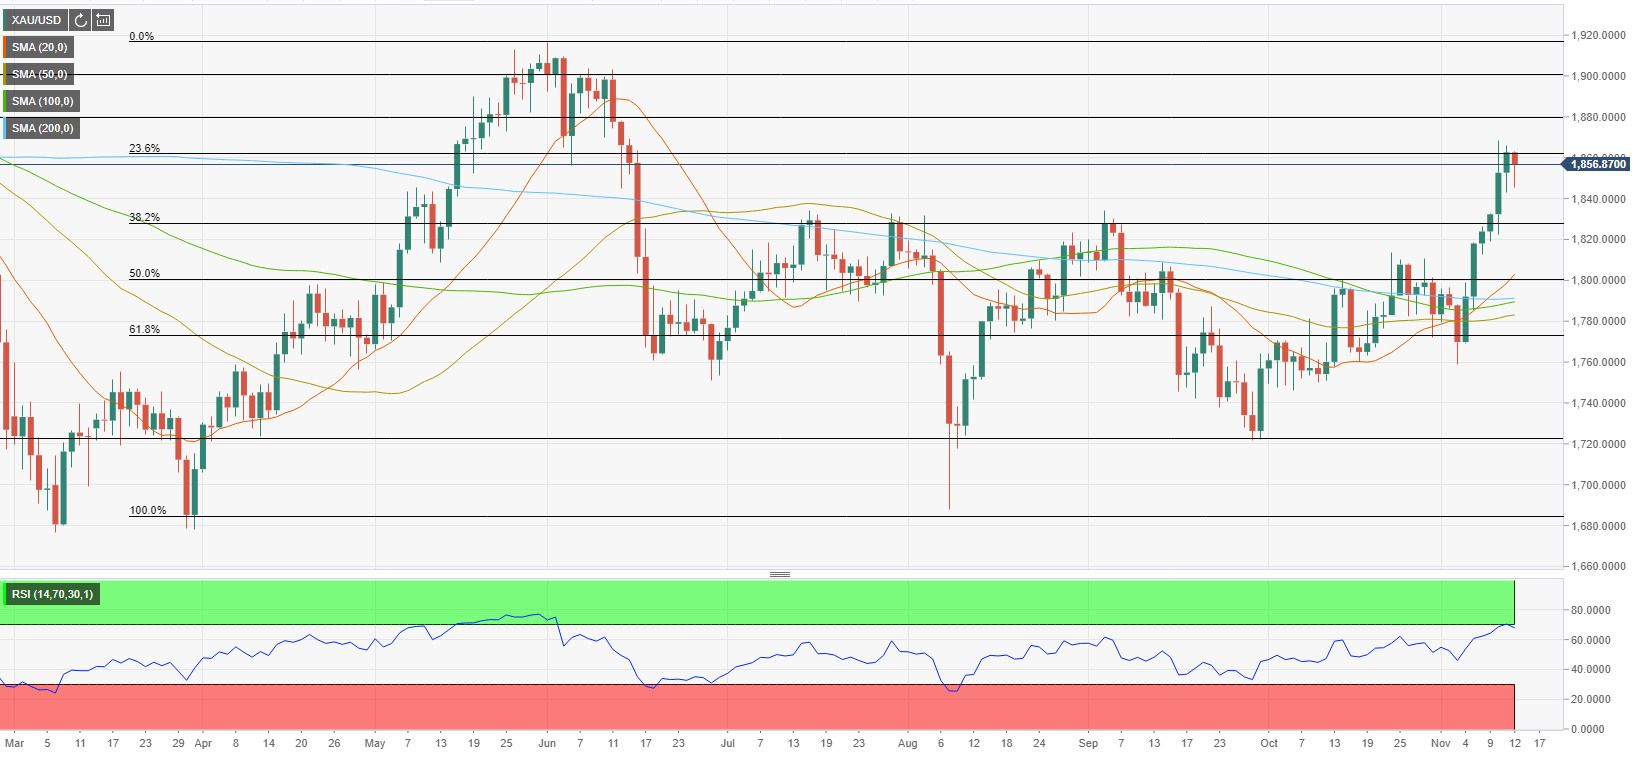
Following the six-day rally, the Relative Strength Index (RSI) indicator on the daily chart reached 70, suggesting that Friday’s decline was a technical correction rather than a reversal of direction. However, Gold seems to have lost its bullish momentum near a key Fibonacci retracement level and buyers might want to stay on the sidelines before committing to additional gains.
On the downside, $1,830 (previous resistance, Fibonacci 38.2% retracement of April-June uptrend) aligns as key support. In case bulls continue to defend this area and don’t allow it to turn into resistance, XAU/USD is likely to regain its traction. Below that level, $1,800 (psychological level) could be seen as the next support before $1,790 (100-day SMA, 200-day SMA).
Above $1,865 (Fibonacci 23.6% retracement), resistances are located at $1,880 (static level) and $1,900 (psychological level).
Gold sentiment poll
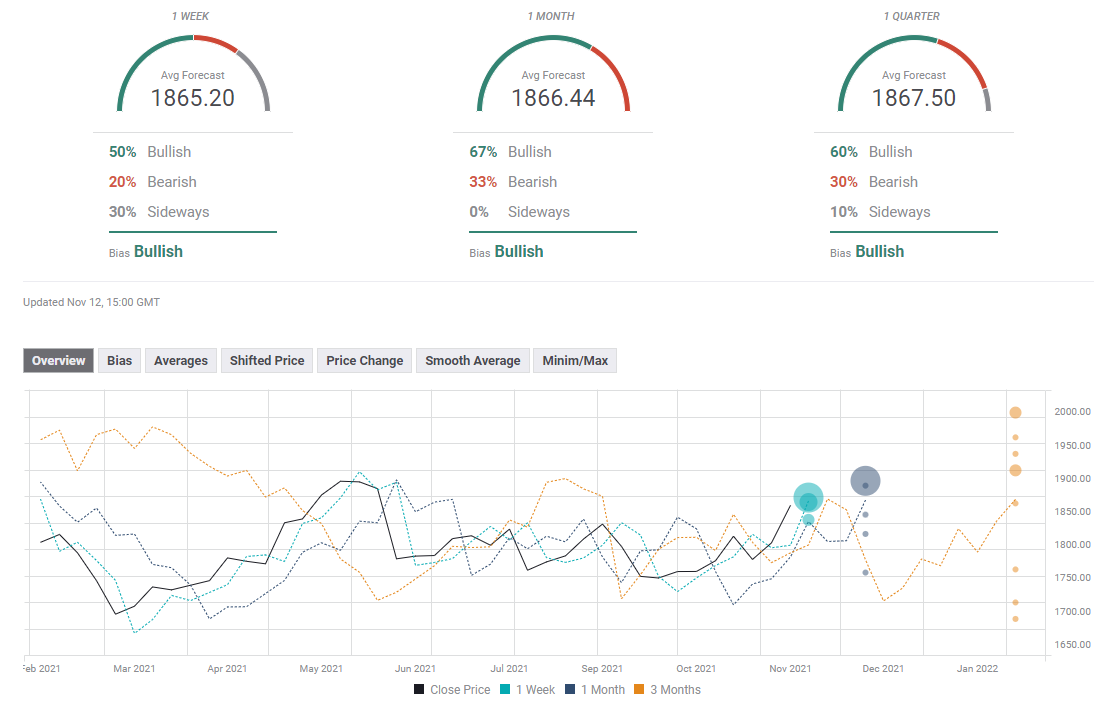
The FXStreet Forecast Poll reveals a bullish shift in the near term but the average target of $1,865 suggests that gold could stay in a consolidation phase next week.
Author

Eren Sengezer
FXStreet
As an economist at heart, Eren Sengezer specializes in the assessment of the short-term and long-term impacts of macroeconomic data, central bank policies and political developments on financial assets.


