- Gold price sets off the week on the right footing after Friday’s rebound.
- $1,792 is the tough nut for gold bulls amid Fed’s tightening expectations.
- Gold sellers eye $1,750 as Fed stays on tightening path.
The mixed US employment report fails to deter the Fed’s faster tapering and tightening expectations, which could likely temper gold’s solid recovery from monthly troughs. Although the downside appears cushioned in the bright metal amid looming uncertainty over the Omicron covid variant and upcoming US Inflation data. The renewed upside in gold could pick up pace should the Treasury yields and the US dollar fade their rebound, in the face of a data-light docket.
Read: Gold Price Forecast: XAU/USD bears to test bulls’ commitments at critical resistance
Gold Price: Key levels to watch
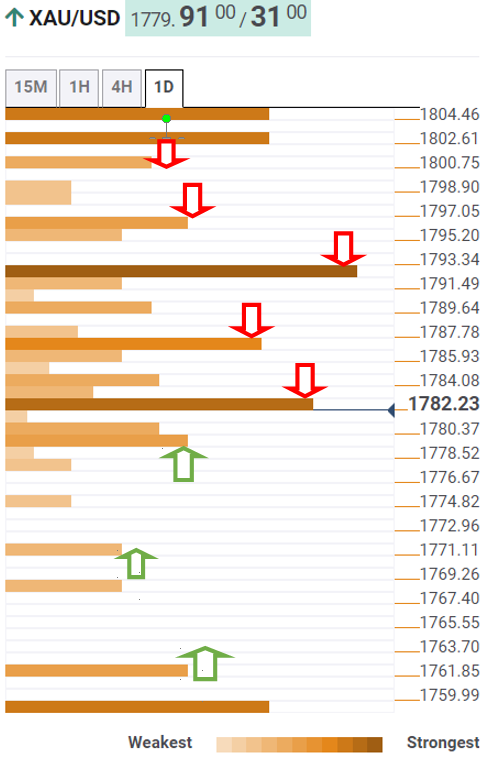
The Technical Confluences Detector shows that the gold price is consolidating Friday’s rebound below the SMA10 one-day at $1,785.
Gold bulls await a sustained break above the latter to test a strong upside barrier in $1,787, which is the confluence of the Fibonacci 23.6% one-month, SMA50 four-hour and Friday’s high.
Critical resistance at $1,792 is the level to beat for gold bulls. That price zone is the intersection of the SMAs50, 100 and 200 one-day.
The pivot point one-day R2 at $1,800 will challenge the further upside.
On the flip side, the intersection of the Fibonacci 38.2% one-week and one-month at $1,779 will be crucial for buyers to defend.
A sharp sell-off below the latter cannot be ruled out, with eyes on $1,772, the meeting point of Fibonacci 61.8% one-day and Fibonacci 23.6% one-week.
Further south, a test of the November lows of $1,759 will be in the offing.
Here is how it looks on the tool
About Technical Confluences Detector
The TCD (Technical Confluences Detector) is a tool to locate and point out those price levels where there is a congestion of indicators, moving averages, Fibonacci levels, Pivot Points, etc. If you are a short-term trader, you will find entry points for counter-trend strategies and hunt a few points at a time. If you are a medium-to-long-term trader, this tool will allow you to know in advance the price levels where a medium-to-long-term trend may stop and rest, where to unwind positions, or where to increase your position size.
Information on these pages contains forward-looking statements that involve risks and uncertainties. Markets and instruments profiled on this page are for informational purposes only and should not in any way come across as a recommendation to buy or sell in these assets. You should do your own thorough research before making any investment decisions. FXStreet does not in any way guarantee that this information is free from mistakes, errors, or material misstatements. It also does not guarantee that this information is of a timely nature. Investing in Open Markets involves a great deal of risk, including the loss of all or a portion of your investment, as well as emotional distress. All risks, losses and costs associated with investing, including total loss of principal, are your responsibility. The views and opinions expressed in this article are those of the authors and do not necessarily reflect the official policy or position of FXStreet nor its advertisers. The author will not be held responsible for information that is found at the end of links posted on this page.
If not otherwise explicitly mentioned in the body of the article, at the time of writing, the author has no position in any stock mentioned in this article and no business relationship with any company mentioned. The author has not received compensation for writing this article, other than from FXStreet.
FXStreet and the author do not provide personalized recommendations. The author makes no representations as to the accuracy, completeness, or suitability of this information. FXStreet and the author will not be liable for any errors, omissions or any losses, injuries or damages arising from this information and its display or use. Errors and omissions excepted.
The author and FXStreet are not registered investment advisors and nothing in this article is intended to be investment advice.
Recommended content
Editors’ Picks
EUR/USD stays near 1.0850 after US housing data
EUR/USD trades in negative territory at around 1.0850 in the early American session on Tuesday. The US Dollar preserves its strength following the upbeat housing data and makes it difficult for the pair to gain traction. The two-day Fed meeting goes underway on Tuesday.
GBP/USD recovers modestly from two-week lows, trades near 1.2700
GBP/USD staged a modest rebound after touching its lowest level in two weeks below 1.2700 on Tuesday. The cautious market mood helps the US Dollar hold its ground and limits the pair's upside as markets gear up for the Fed and the BoE policy meetings.
Gold stays in daily range near $2,160
Gold fluctuates in a narrow band at around $2,160 for the second consecutive day on Tuesday. Ahead of the Fed's policy announcements, the benchmark 10-year US Treasury bond yield moves sideways near 4.3% and limits's XAU/USD's volatility.
Why is the crypto market crashing?
The two most important contribution to the ongoing bull market is the meteoric rise in Bitcoin due to the ETF approval and the sudden interest spike in Solana ecosystem. But the recent move suggests that the upward momentum is dissipating and a correction looms.
Shocker, Yen weakens after BoJ hike
The Bank of Japan (BoJ) scrapped its negative rate policy, raised the rates from -0.10% to 0%, ditched its YCC policy and ended the purchases of ETF and Japanese real estate investment trusts.