Gold price pares gains following Nonfarm Payrolls
- Gold price pares the gains it made following the release of a below-expectations US Nonfarm Payrolls report.
- The data came out lower-than-expected across the board, with payrolls rising 175K versus the 243K forecast.
- Average Hourly Earnings, the Unemployment Rate and Average Weekly Hours worked also all undershoot expectations.

The Gold price (XAU/USD) gives back all the gains it made after the release of the Nonfarm Payrolls report on Friday. Initially the precious metal rose to around $2,310s – an over half a percent gain – after the release of US Nonfarm Payrolls (NFP) undershot analysts' expectations. However, bears took over and pushed the Gold price lower and it is now trading back down in the $2,280s, showing an overall loss for the day.
The overall positive tone to market sentiment during Friday may have been a catalyst for the decline in Gold price which tends to perform better during periods of crisis because of its safe-haven appeal. The positive sentiment led to a rally in US stocks rose on Friday, with the S&P 500 Index up 0.92%, at 5,110 at the time of press.
Gold price surges after Nonfarm Payrolls miss expectations
Gold price initially surged on friday after the US NFP report showed 175K new workers joined the ranks of the employed in April, which was below ther 243K expected and the upwardly-revised 315K of the previous month, according to data released by the Bureau of Labor Statistics.
Average Hourly Earnings came in softer at 3.9% YoY and 0.2% MoM, compared to estimates of 4.0% and 0.3%. This was also lower than the 4.1% and 0.3% of the previous month. The slight decline in the pace of earnings growth suggests lessening inflationary pressures. This in turn may increase the chances that the Federal Reserve (Fed) will cut interest rates sooner than anticipated. The expectation of lower interest rates weighs on the US Dollar (USD) as it reduces capital inflows, and the US Dollar Index (DXY) fell over half a percent after the release.
Other data in the NFP report showed that Average Hours Worked fell to 34.3 from 34.4 previously and the same expected, probably reflecting an increase in part-time work, usually interpreted as negative by economists.
The Unemployment Rate ticked down to 3.9% from 3.8% previously when no change had been forecast. The participation rate remained the same at 62.7%.
Other data out on Friday showed a deeper-than-expected decline in the US ISM Services PMI in April, which fell to 49.4 when a rise to 52.0 had been forecast from 51.4 previously. The Services sector is significant in terms of interest rates because it has been singled-out as generating high wage inflation, and thereby keeping interest rates high.
Technical Analysis: Gold price tracks sideways
Gold price (XAU/USD) rebounds on the 4-hour Chart. It has stopped declining after meeting the conservative requirement for completing its bearish Measured Move price pattern at the Fibonacci 0.681 price objective for wave C, at $2,286.
XAU/USD 4-hour Chart
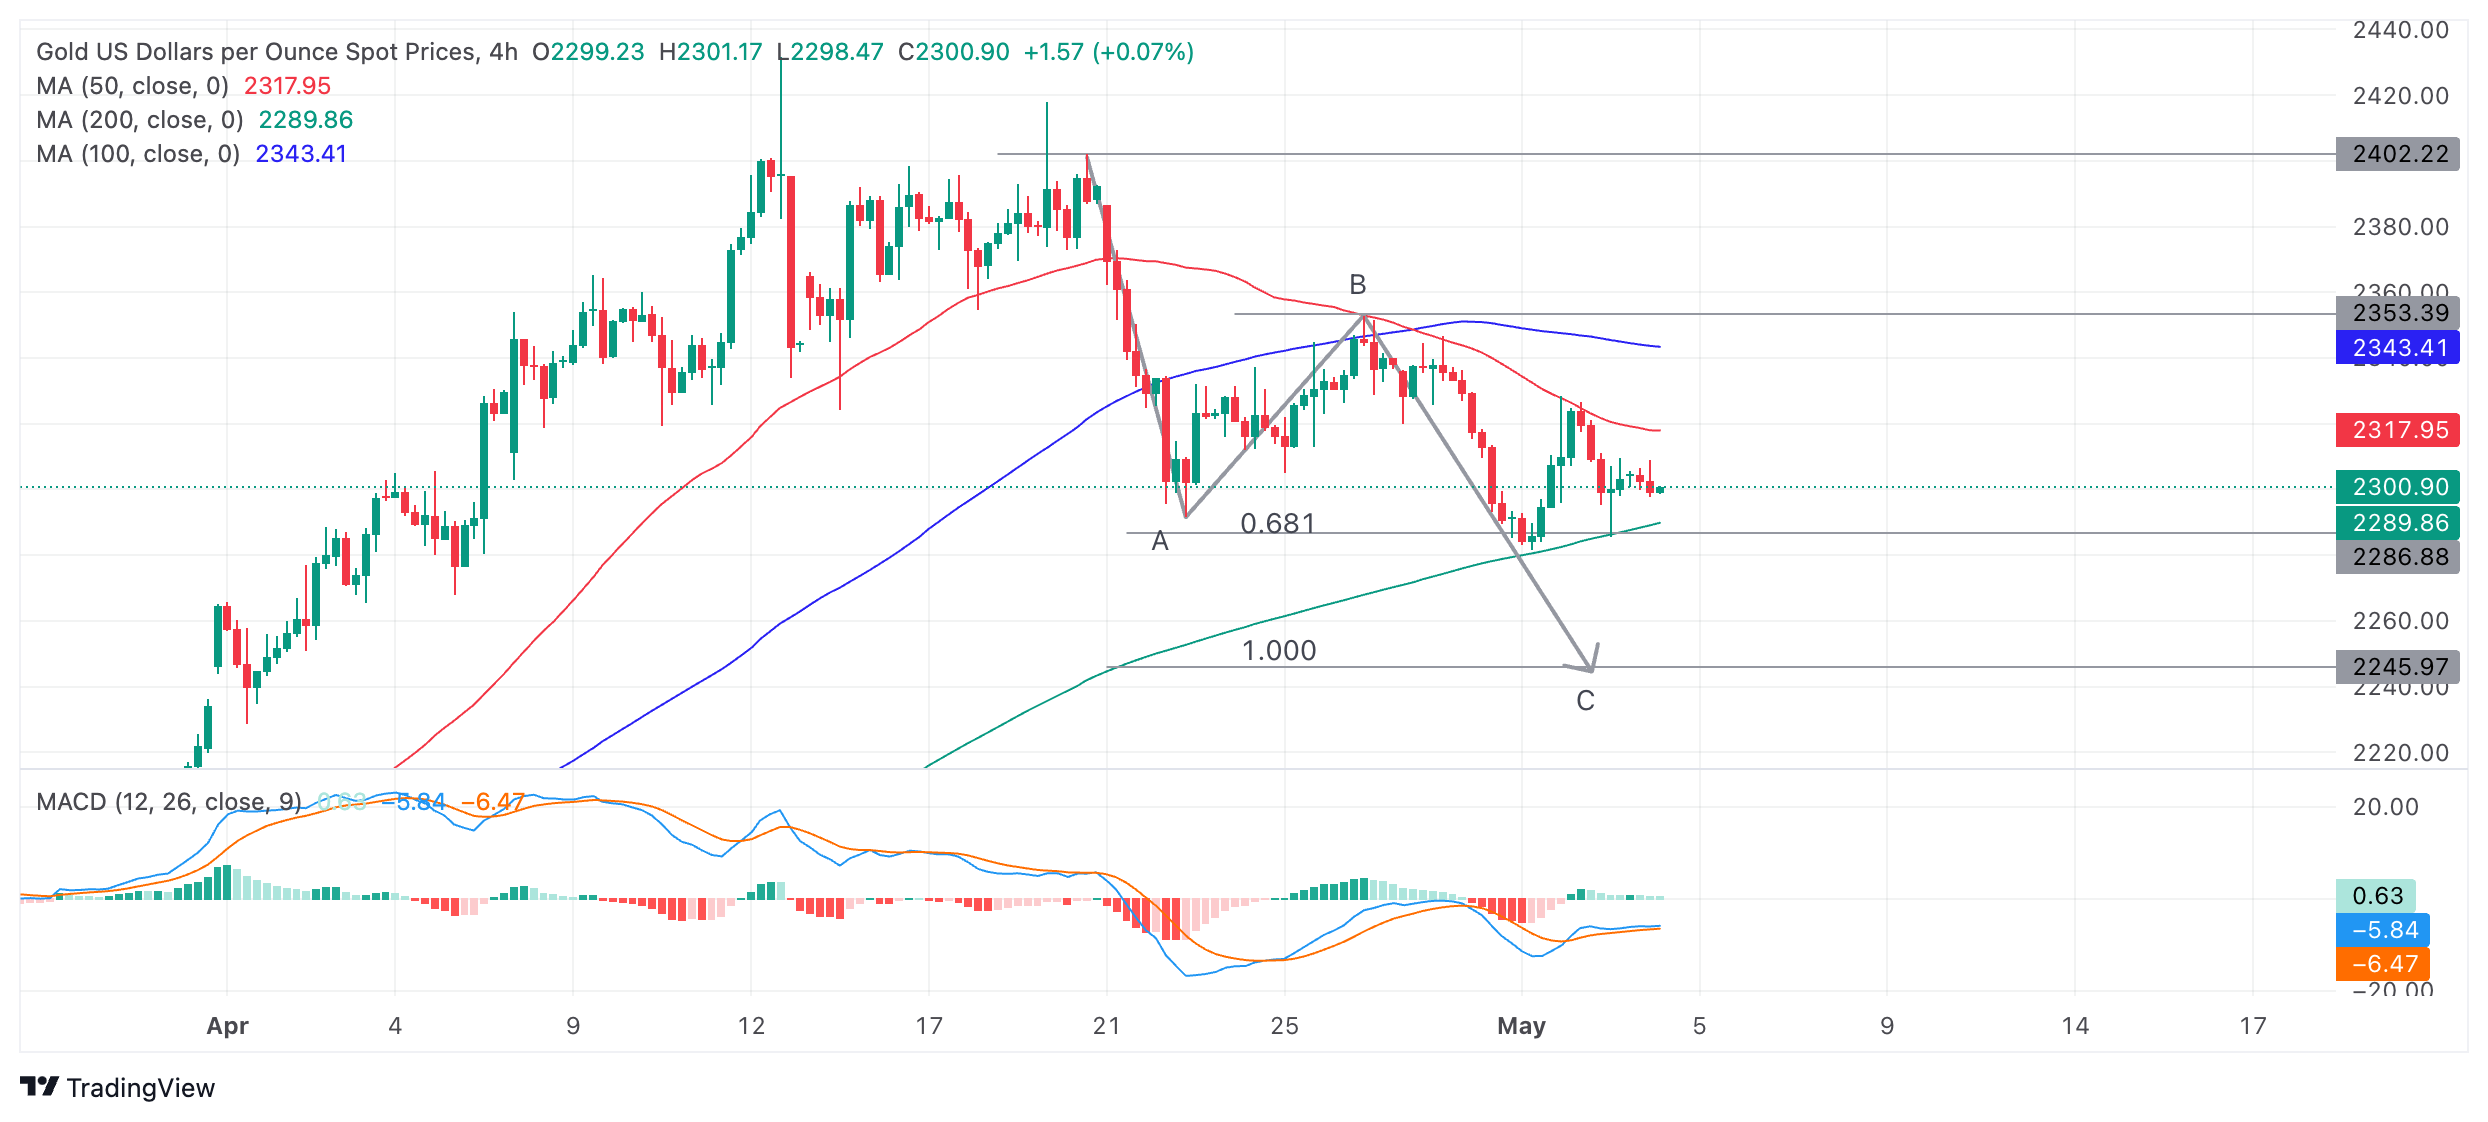
The Measured Move, a zig-zag type pattern, could still unfold if wave C has lower to go. Although it has met its conservative objective at the 0.681 Fibonacci target, it could still fall to a second target at the point where wave C equals the length of wave A. Alternatively, it may have finished unfolding altogether – both outcomes are possible.
Directionally, Gold is in a bit of a no-man’s land: a break below the 0.681 Fibonacci target lows at $2,285 would be needed to confirm more downside to a target at $2,245 (1.000 or where A=C).
Alternatively, a break above the cluster of Moving Averages and the peak of wave B at around $2,350 would potentially usher in a new more bullish environment. This could then see a retest of the $2,400 highs.
Additionally, the trend for Gold price is up on both the medium and long-term charts (daily and weekly), overall supporting the outlook on lower time frames.
Economic Indicator
ISM Services PMI
The Institute for Supply Management (ISM) Services Purchasing Managers Index (PMI), released on a monthly basis, is a leading indicator gauging business activity in the US services sector, which makes up most of the economy. The indicator is obtained from a survey of supply executives across the US based on information they have collected within their respective organizations. Survey responses reflect the change, if any, in the current month compared to the previous month. A reading above 50 indicates that the services economy is generally expanding, a bullish sign for the US Dollar (USD). A reading below 50 signals that services sector activity is generally declining, which is seen as bearish for USD.
Read more.Last release: Fri May 03, 2024 14:00
Frequency: Monthly
Actual: 49.4
Consensus: 52
Previous: 51.4
Source: Institute for Supply Management
The Institute for Supply Management’s (ISM) Services Purchasing Managers Index (PMI) reveals the current conditions in the US service sector, which has historically been a large GDP contributor. A print above 50 shows expansion in the service sector’s economic activity. Stronger-than-expected readings usually help the USD gather strength against its rivals. In addition to the headline PMI, the Employment Index and the Prices Paid Index numbers are also watched closely by investors as they provide useful insights regarding the state of the labour market and inflation.
Author

Joaquin Monfort
FXStreet
Joaquin Monfort is a financial writer and analyst with over 10 years experience writing about financial markets and alt data. He holds a degree in Anthropology from London University and a Diploma in Technical analysis.


