|

Gold Price Analysis: XAU/USD’s downside more compelling amid strong resistance levels – Confluence Detector

Gold (XAU/USD) attempts another bounce on Tuesday, although remains within the familiar rage of $1820-$1850, as the focus now shifts towards Wednesday’s FOMC decision.  

Gold finds its feet, benefiting from the downbeat market mood, as the growth in coronavirus infections and fresh lockdowns offset the optimism driven by the vaccine inoculations. Meanwhile, increased odds of about $1 trillion covid relief package likely to be reached before the X-mas/ New Year holiday also lend support to the XAU bulls.

How is gold positioned technically?

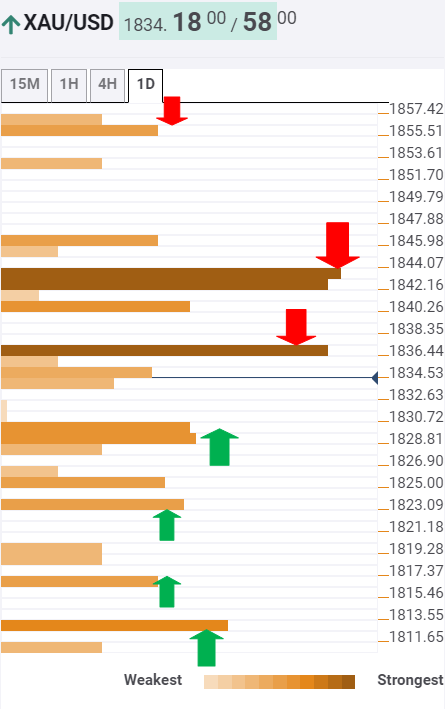
The Technical Confluences Indicator shows that the XAU/USD pair is closing in on a powerful resistance at $1837, which is the Bollinger Band one-day Middle.

On a break above the latter, the bulls could challenge the $1840 level, which is the confluence of the Pivot Point one-day R1 and SMA10 one-day.

Further up, a dense cluster of healthy resistance levels awaits at $1843, where the previous day high coincides with the Fibonacci 38.2% one-month, SMA50 four-hour and Fibonacci 61.8% one-week.

Recapturing the abovementioned strong barrier is critical to extending the recovery towards $1855, the Fibonacci 38.2% one-week.

On the flip side, the spot is likely to meet initial demand at $1829, the convergence of the SMA100 and 5 four-hour, Bollinger Band one-hour Middle and Previous High on four-hour.

The next soft downside caps are seen around $1825/$1823, which is the previous week low and Fibonacci 23.6% one-day.

Sellers would then target the $11816 support, the Pivot Point one-week S1. Meanwhile, the Fibonacci 23.6% one-month at $1812.50 will be the level to beat for the bears.

Here is how it looks on the tool

fxsoriginal

About Confluence Detector

The TCI (Technical Confluences Indicator) is a tool to locate and point out those price levels where there is a congestion of indicators, moving averages, Fibonacci levels, Pivot Points, etc. Knowing where these congestion points are located is very useful for the trader, and can be used as a basis for different strategies.

Learn more about Technical   Confluence

Author

Dhwani Mehta

Dhwani Mehta

FXStreet

Residing in Mumbai (India), Dhwani is a Senior Analyst and Manager of the Asian session at FXStreet. She has over 10 years of experience in analyzing and covering the global financial markets, with specialization in Forex and commodities markets.

More from Dhwani Mehta
Share:

Markets move fast. We move first.

Orange Juice Newsletter brings you expert driven insights - not headlines. Every day on your inbox.

By subscribing you agree to our Terms and conditions.

Editor's Picks

EUR/USD: Sellers attack 1.1700 as USD stages a solid comeback

EUR/USD attacks 1.1700 amid heavy selling interest in the European trading hours on Wednesday. A solid comeback staged by the US Dollar weighs heavily on the pair, as traders look to USD short covering ahead of US CPI on Thursday. However, the downside could be capped by hawkish ECB expectations. 

GBP/USD slides toward 1.3300 after softer-than-expected UK inflation data

GBP/USD has come under intense selling pressure, eyeing 1.3300 in the European session on Wednesday. The UK annual headline and core CPI rose by 3.2% each, missing estimates of 3.5% and 3.4%, respectively, reaffirming dovish BoE expectations and smashing the Pound Sterling across the board. 

Gold: Bulls await breakout through multi-day-old range amid Fed rate cut bets

Gold attracts fresh buyers during the Asian session on Wednesday, though it remains confined in a multi-day-old trading range amid mixed fundamental cues. The global risk sentiment remains on the defensive amid economic woes and fears of the AI bubble burst. Moreover, dovish US Federal Reserve expectations lend support to the non-yielding yellow metal, though a modest US Dollar uptick might cap any further appreciating move.

Bitcoin, Ethereum and Ripple extend correction as bearish momentum builds

Bitcoin, Ethereum, and Ripple remain under pressure as the broader market continues its corrective phase into midweek. The weak price action of these top three cryptocurrencies by market capitalization suggests a deeper correction, as momentum indicators are beginning to tilt bearish.

Ukraine-Russia in the spotlight once again

Since the start of the week, gold’s price has moved lower, but has yet to erase the gains made last week. In today’s report we intend to focus on the newest round of peace talks between Russia and Ukraine, whilst noting the release of the US Employment data later on day and end our report with an update in regards to the tensions brewing in Venezuela.

AAVE slips below $186 as bearish signals outweigh the SEC investigation closure

Aave (AAVE) price continues its decline, trading below $186 at the time of writing on Wednesday after a rejection at the key resistance zone. Derivatives positioning and momentum indicators suggest that bearish forces still dominate in the near term.