Gold Price Analysis: XAU/USD’s downside appears cushioned ahead of Yellen’s hearings – Confluence Detector


Having tested the $1800 level, Gold (XAU/USD) extends Monday’s swift recovery ahead of the much-awaited Treasury Secretary nominee Janet Yellen’s Senate hearings. Yellen is set to endorse a bigger coronavirus relief package.

Meanwhile, President-elect Biden will push for the $1.9 trillion stimulus plan once he takes the office on January 20. Expectations of additional fiscal support to fight the pandemic recession continue to bode well for the inflation-hedge, gold. Let’s take a look at how the metal is positioned on the charts.

Gold Price Chart: Key resistances and supports

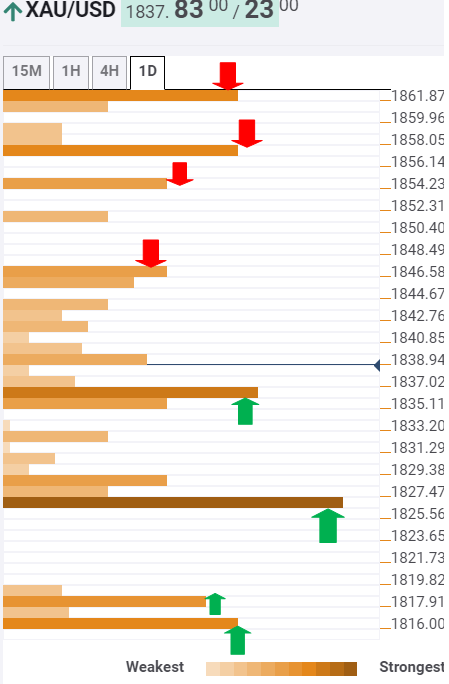
The Technical Confluences Indicator shows that gold sees healthy support levels, with the immediate cushion seen at $1836, which is the confluence of the SMA5 four-hour, Fibonacci 38.2% one-week and Bollinger Band one-hour Middle.

The next major support awaits at the Fibonacci 23.6% one-week at $1828, below which $1826 could challenge the bears’ commitment. At that level, the Fibonacci 61.8% one-month coincides with the Fibonacci 38.2% one-day.

Further south, the intersection of the previous week low and Fibonacci 61.8% one-day at $1818 will guard the downside before testing the $1816 cap – pivot point one-month S1.

Alternatively, the bulls need to crack the Fibonacci 61.8% one-week at $1846 to extend the recovery momentum from over one-month lows of $1803.

The next significant resistance is aligned at $1854, the pivot point one-week R1. A break above the latter could expose $1858, which is the convergence of the Fibonacci 38.2% one-month and and SMA50 four-hour.

The SMA50 one-day at $1860 is the level to beat for the XAU bulls.

Here is how it looks on the tool

fxsoriginal

About Confluence Detector

The TCI (Technical Confluences Indicator) is a tool to locate and point out those price levels where there is a congestion of indicators, moving averages, Fibonacci levels, Pivot Points, etc. Knowing where these congestion points are located is very useful for the trader, and can be used as a basis for different strategies.


Share: Feed news

Information on these pages contains forward-looking statements that involve risks and uncertainties. Markets and instruments profiled on this page are for informational purposes only and should not in any way come across as a recommendation to buy or sell in these assets. You should do your own thorough research before making any investment decisions. FXStreet does not in any way guarantee that this information is free from mistakes, errors, or material misstatements. It also does not guarantee that this information is of a timely nature. Investing in Open Markets involves a great deal of risk, including the loss of all or a portion of your investment, as well as emotional distress. All risks, losses and costs associated with investing, including total loss of principal, are your responsibility. The views and opinions expressed in this article are those of the authors and do not necessarily reflect the official policy or position of FXStreet nor its advertisers. The author will not be held responsible for information that is found at the end of links posted on this page.

If not otherwise explicitly mentioned in the body of the article, at the time of writing, the author has no position in any stock mentioned in this article and no business relationship with any company mentioned. The author has not received compensation for writing this article, other than from FXStreet.

FXStreet and the author do not provide personalized recommendations. The author makes no representations as to the accuracy, completeness, or suitability of this information. FXStreet and the author will not be liable for any errors, omissions or any losses, injuries or damages arising from this information and its display or use. Errors and omissions excepted.

The author and FXStreet are not registered investment advisors and nothing in this article is intended to be investment advice.

Recommended content


Recommended content

Editors’ Picks

AUD/USD failed just ahead of the 200-day SMA

AUD/USD failed just ahead of the 200-day SMA

Finally, AUD/USD managed to break above the 0.6500 barrier on Wednesday, extending the weekly recovery, although its advance faltered just ahead of the 0.6530 region, where the key 200-day SMA sits.

AUD/USD News

EUR/USD met some decent resistance above 1.0700

EUR/USD met some decent resistance above 1.0700

EUR/USD remained unable to gather extra upside traction and surpass the 1.0700 hurdle in a convincing fashion on Wednesday, instead giving away part of the weekly gains against the backdrop of a decent bounce in the Dollar.

EUR/USD News

Gold keeps consolidating ahead of US first-tier figures

Gold keeps consolidating ahead of US first-tier figures

Gold finds it difficult to stage a rebound midweek following Monday's sharp decline but manages to hold above $2,300. The benchmark 10-year US Treasury bond yield stays in the green above 4.6% after US data, not allowing the pair to turn north.

Gold News

Bitcoin price could be primed for correction as bearish activity grows near $66K area

Bitcoin price could be primed for correction as bearish activity grows near $66K area

Bitcoin (BTC) price managed to maintain a northbound trajectory after the April 20 halving, despite bold assertions by analysts that the event would be a “sell the news” situation. However, after four days of strength, the tables could be turning as a dark cloud now hovers above BTC price.

Read more

Bank of Japan's predicament: The BOJ is trapped

Bank of Japan's predicament: The BOJ is trapped

In this special edition of TradeGATEHub Live Trading, we're joined by guest speaker Tavi @TaviCosta, who shares his insights on the Bank of Japan's current predicament, stating, 'The BOJ is Trapped.' 

Read more

Forex MAJORS

Cryptocurrencies

Signatures