|

Gold Price Analysis: XAU/USD trades below 200-day MA for first since March

  • Gold has flipped the 200-day SMA support into resistance. 
  • The breakdown has opened the doors to support at $1,765.

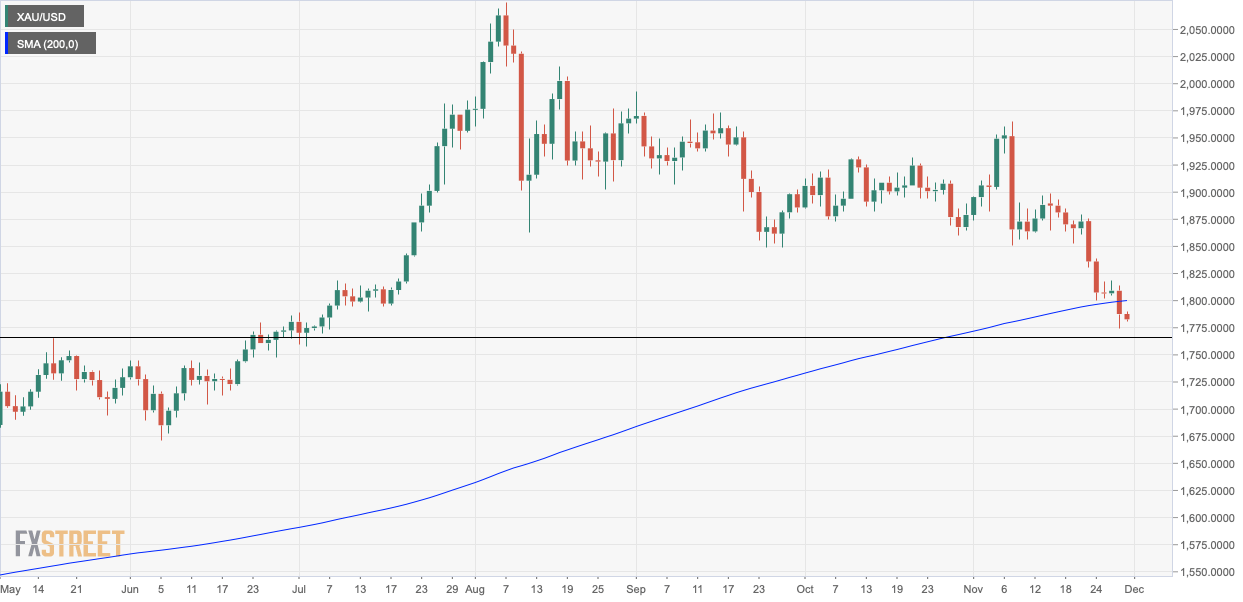
Gold is trading below the widely-followed 200-day Simple Moving Average (SMA) for the first time since March. 

The long-term technical line is currently located at $1,800 and the metal is changing hands near $1,783 per ounce, representing a 0.25% loss on the day. 

The yellow metal closed below the 200-day SMA on Friday, exposing deeper support at $1,765 (May 18 low). The breakdown has been reinforced by the bull failure at the former support-turned-hurdle of the 200-day SMA seen early today. 

While the 14-day relative strength index has dropped below 30 to indicate oversold condition, the indicator would gain credence if and when signs of seller exhaustion emerge on the price chart

The immediate bearish view would be invalidated if the metal finds acceptance above the 200-day SMA at $1,800.

Daily chart

Trend: Bearish

Technical levels

XAU/USD

Overview
Today last price1783.31
Today Daily Change-4.37
Today Daily Change %-0.24
Today daily open1787.68
 
Trends
Daily SMA201870.03
Daily SMA501885.53
Daily SMA1001910.3
Daily SMA2001799.2
 
Levels
Previous Daily High1813.89
Previous Daily Low1774.4
Previous Weekly High1876.14
Previous Weekly Low1774.4
Previous Monthly High1933.3
Previous Monthly Low1860
Daily Fibonacci 38.2%1789.49
Daily Fibonacci 61.8%1798.8
Daily Pivot Point S11770.09
Daily Pivot Point S21752.5
Daily Pivot Point S31730.6
Daily Pivot Point R11809.58
Daily Pivot Point R21831.48
Daily Pivot Point R31849.07

Author

Omkar Godbole

Omkar Godbole

FXStreet Contributor

Omkar Godbole, editor and analyst, joined FXStreet after four years as a research analyst at several Indian brokerage companies.

More from Omkar Godbole
Share:

Markets move fast. We move first.

Orange Juice Newsletter brings you expert driven insights - not headlines. Every day on your inbox.

By subscribing you agree to our Terms and conditions.

Editor's Picks

EUR/USD recovers to 1.1750 region as 2025 draws to a close

Following the bearish action seen in the European session on Wednesday, EUR/USD regains its traction and recovery to the 1.1750 region. Nevertheless, the pair's volatility remains low as trading conditions thin out on the last day of the year.

GBP/USD stays weak near 1.3450 on modest USD recovery

GBP/USD remains under modest beairsh pressure and fluctuates at around 1.3450 on Wednesday. The US Dollar finds fresh demand due to the end-of-the-year position adjustments, weighing on the pair amid the pre-New Year trading lull. 

Gold climbs to near $4,350 on Fed rate cut bets, geopolitical risks

Gold price rises to near $4,345 during the early Asian session on Friday. Gold finished 2025 with a significant rally, achieving an annual gain of around 65%, its biggest annual gain since 1979. The rally of the precious metal is bolstered by the prospect of further US interest rate cuts in 2026 and safe-haven flows.

Bitcoin, Ethereum and XRP prepare for a potential New Year rebound

Bitcoin, Ethereum, and Ripple are holding steady on Wednesday after recording minor gains on the previous day. Technically, Bitcoin could extend gains within a triangle pattern while Ethereum and Ripple face critical overhead resistance. 

Economic outlook 2026-2027 in advanced countries: Solidity test

After a year marked by global economic resilience and ending on a note of optimism, 2026 looks promising and could be a year of solid economic performance. In our baseline scenario, we expect most of the supportive factors at work in 2025 to continue to play a role in 2026.

Crypto market outlook for 2026

Year 2025 was volatile, as crypto often is.  Among positive catalysts were favourable regulatory changes in the U.S., rise of Digital Asset Treasuries (DAT), adoption of AI and tokenization of Real-World-Assets (RWA).