|

Gold Price Analysis: XAU/USD set to test 7-year highs amid lack of healthy resistance levels

  • Gold looks to break Friday’s range trade to the upside.
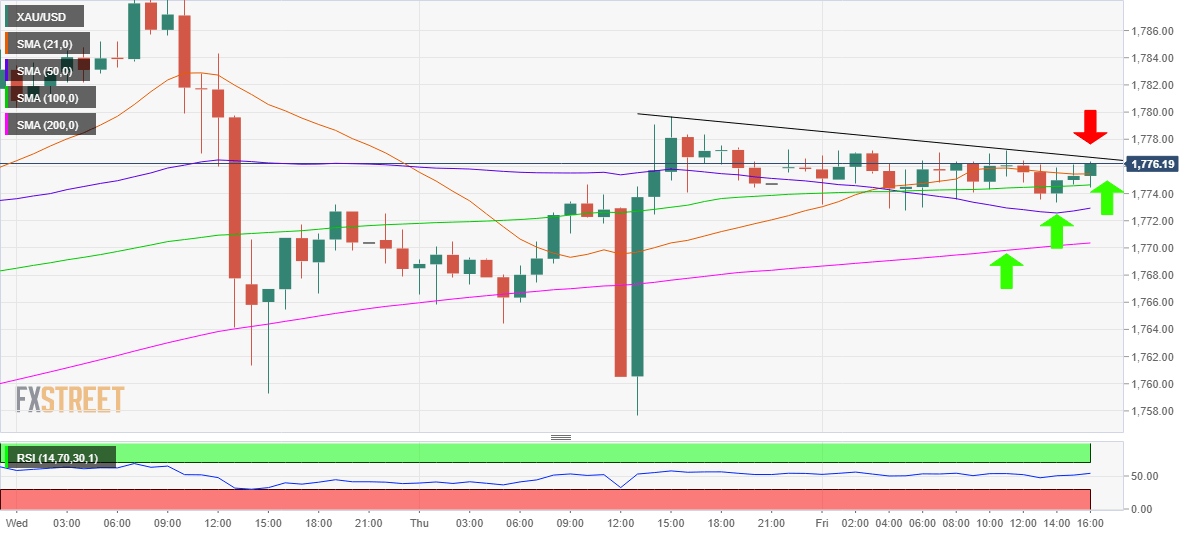
  • Falling trendline hurdle at $1776.60 is the level to beat for the bulls.
  • XAU/USD closed above all major hourly Simple Moving Averages (HMA).

Following consolidation in a $5 range on holiday-thinned Friday, Gold prices (XAU/USD) are poised for another leg higher after falling off the seven-year tops of $1789.28 last Wednesday.

With looming concerns over a surge in the coronavirus cases worldwide and economic recovery unlikely to wane, gold could likely continue drawing the haven bids in the near-tern.

Although the ongoing optimism on the global stocks could slowdown the yellow metal’s advances towards the $1800 mark.

Technically, looking at the hourly chart, gold is set to break through the falling trendline resistance aligned at $1776.60, also where Friday’s high converges.

Acceptance above the latter could see a test of the multi-year high. The hourly Relative Strength Index (RSI) points northwards at 56.05, hinting at more room for the upside.

Also, the fact that the price closed above the 21-HMA at $1775.45 adds credence to the near-term bullish outlook. Its worth noting that the XAU bulls have regained ground above all the major HMAs.

On the flip side, the immediate downside could be capped by the 21-HMA, below which the next support awaits at the horizontal 100-HMA at $1774.64.

Further south, the 50-HMA at $1772.93 is likely to offer some temporary reprieve to the bulls while the 200-HMA at $1770.36 is the level to beat for the bears in the coming days.

All in all, the path of least resistance appears to the upside amid a lack of healthy resistance levels.

Gold: Hourly chart
fxsoriginal

Gold: Additional levels

XAU/USD

Overview
Today last price1776.19
Today Daily Change0.00
Today Daily Change %0.00
Today daily open1776.19
 
Trends
Daily SMA201747.5
Daily SMA501728.5
Daily SMA1001678.16
Daily SMA2001593.25
 
Levels
Previous Daily High1777.21
Previous Daily Low1772.76
Previous Weekly High1789.28
Previous Weekly Low1757.7
Previous Monthly High1785.91
Previous Monthly Low1670.76
Daily Fibonacci 38.2%1775.51
Daily Fibonacci 61.8%1774.46
Daily Pivot Point S11773.56
Daily Pivot Point S21770.94
Daily Pivot Point S31769.11
Daily Pivot Point R11778.01
Daily Pivot Point R21779.84
Daily Pivot Point R31782.46

Author

Dhwani Mehta

Dhwani Mehta

FXStreet

Residing in Mumbai (India), Dhwani is a Senior Analyst and Manager of the Asian session at FXStreet. She has over 10 years of experience in analyzing and covering the global financial markets, with specialization in Forex and commodities markets.


More from Dhwani Mehta
Share:

Editor's Picks

AUD/USD turns south toward 0.6900 as USD firms up

AUD/USD sees fresh selling and drops toward 0.6900 in late Asian trading on Monday, as renewed US Dollar strength weighs on the pair amid lingering Middle East and Russia-Ukraine geopolitical tensions. Focus remains on Oil prices, Treasury bond yields, and RBA expectations for fresh trading impetus in the major.

USD/JPY retakes 158.00 amid hawkish BoJ bets, firmer USD

USD/JPY erases losses and retakes 158.00 in the Asian session on Monday, trading within a one-week-old range. Geopolitical uncertainty continues to underpin the US Dollar, despite fading Fed rate hike hopes, supporting the pair's rebound. However, further upside could be capped by hawkish BoJ expectations and looming intervention risks that could support the Japanese Yen.

Gold languishes below $4,200 amid high US yields

Gold trims some losses on Monday, but remains trapped within previous ranges, with upside attempts limited below $4,200 and with two-month lows of $4,110 at a short distance. The recent pullback on the US Dollar Index has provided some support for precious metals although the high US Treasury yields are keeping a floor on US Dollar dips so far.

Pi Network risks a steeper decline as bearish momentum builds

Pi Network extends losses below $0.090 maintaining a steady decline for the fifth consecutive day. The retail demand remains firm, with the notional value of active perpeutals holding above $10 million. The technical outlook for PI remains bearish as bearish momentum mounts.

ISM Services PMI expected to show robust US economy in September

The US ISM Services PMI is expected to improve marginally in September. The US services sector is expected to remain well into expansionary territory. Bets of further Fed tightening appear to have lost traction in the last few days.

Eurozone inflation just hit 3.8%, its highest in three years. This chart shows why the ECB can’t simply hike its way out

The ECB would normally have a relatively straightforward answer to inflation running almost twice its target: raise interest rates. But these are not normal circumstances. This time, the bond market is already doing part of the tightening for it, leaving the ECB facing an increasingly difficult dilemma.