|

Gold Price Analysis: XAU/USD rolling into Asia below $1465/oz

  • Gold is ending Tuesday’s New York session just below the 1465 resistance level. 
  • Support can be seen at the 1455/50 price zone. 
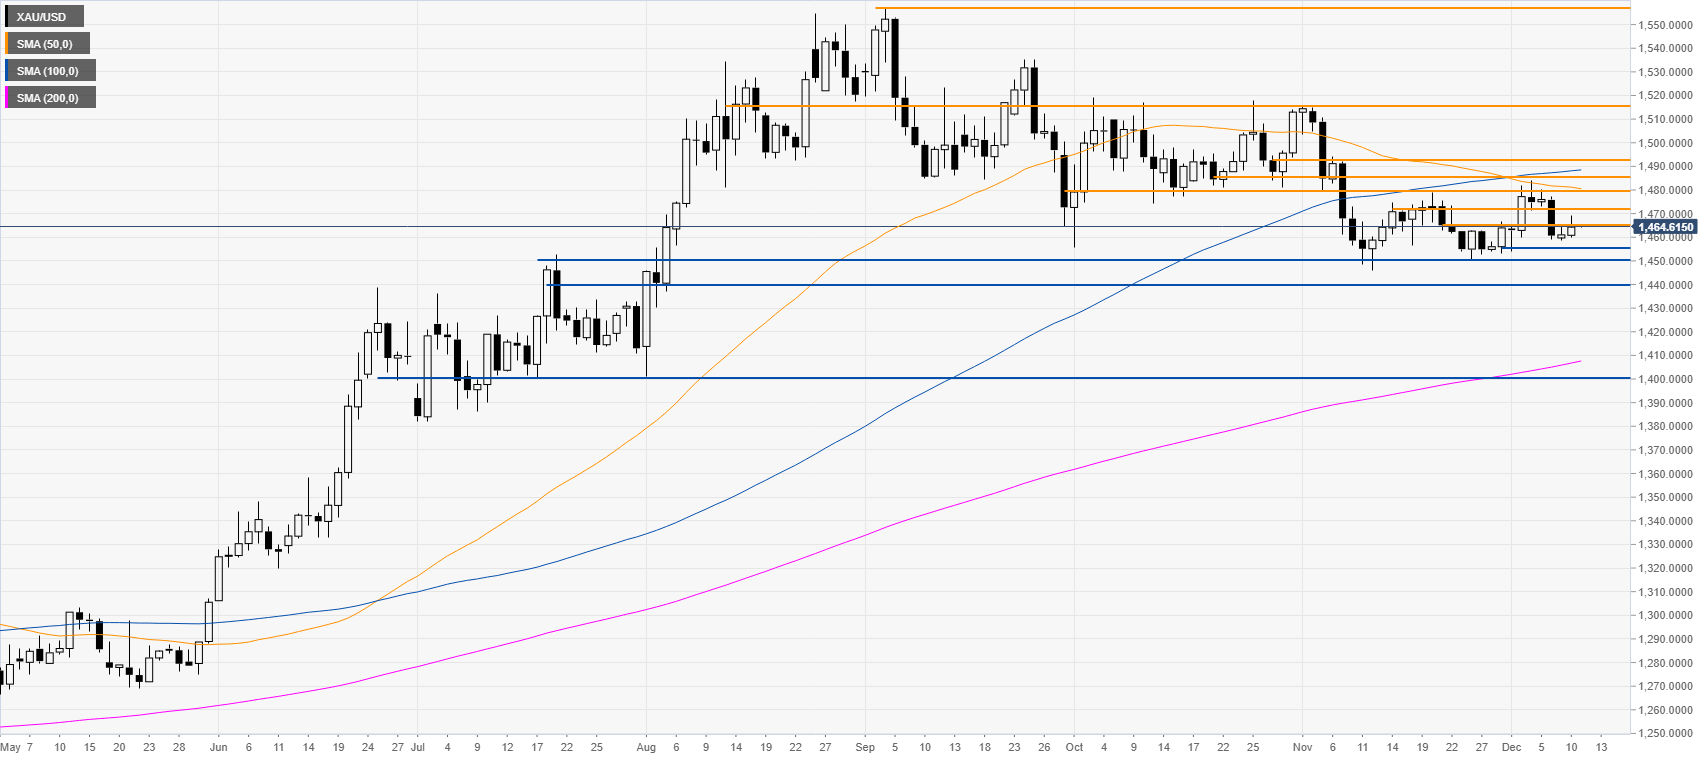
 

Gold daily chart

  
Gold is hovering near four-month lows while trading below the 1465 resistance and its 50/100 SMAs. However, traders should be aware that the FOMC on Wednesday could lead to high volatility. 
 

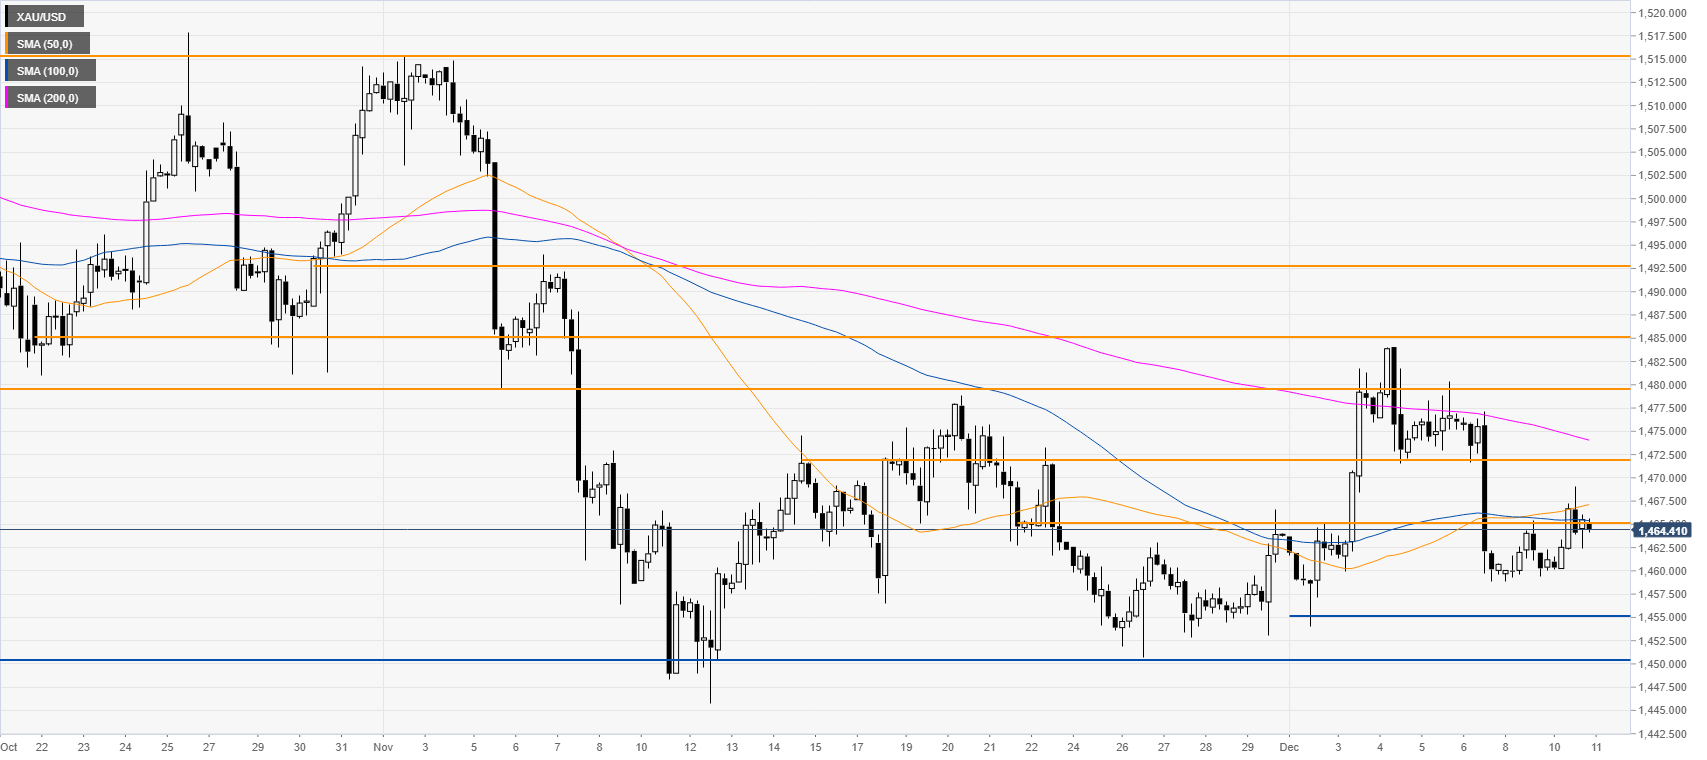
Gold four-hour chart 

 
Tuesday’s bullish attempt failed below the 1472 resistance level. Bulls would need a daily close above that level to attract further buying interest. On the flip side, below the 1465 resistance and the 50/100 SMAs, the metal could remain vulnerable to the downside as bears will likely try to push prices down towards the 1455/50 price zone. 
   

Additional key levels

XAU/USD

Overview
Today last price1464.57
Today Daily Change3.57
Today Daily Change %0.24
Today daily open1461
 
Trends
Daily SMA201465.51
Daily SMA501481.5
Daily SMA1001487.66
Daily SMA2001405.88
 
Levels
Previous Daily High1465.4
Previous Daily Low1458.82
Previous Weekly High1484.06
Previous Weekly Low1454.05
Previous Monthly High1515.38
Previous Monthly Low1445.8
Daily Fibonacci 38.2%1462.88
Daily Fibonacci 61.8%1461.33
Daily Pivot Point S11458.08
Daily Pivot Point S21455.15
Daily Pivot Point S31451.49
Daily Pivot Point R11464.66
Daily Pivot Point R21468.32
Daily Pivot Point R31471.25

Author

Flavio Tosti

Flavio Tosti

Independent Analyst


More from Flavio Tosti
Share:

Editor's Picks

EUR/USD remains cautious near 1.1760 ahead of US data

EUR/USD trades marginally on the defensive at the end of the week, hovering around the 1.1770-1.1760 band against the backdrop of an equally humble advance in the US Dollar. Meanwhile, investors gear up for the release of key US data later in the day, including PCE and GDP figures.

GBP/USD looks slightly bid near 1.3480, focus on US docket

The British Pound gathers some fresh steam on Friday, prompting GBP/USD to reverse four consecutive days of losses and revisit the 1.3480 zone. Cable’s decent bounce comes on the back of modest gains in the Greenback prior to the release of significant US data.

Gold extends the recovery past $5,000/oz, looks at US data

Gold prices advance for the third straight day on Friday, reaching new multi-day highs just north of the key $5,000 mark per troy ounce. The continuation of the precious metal’s uptick follows steady geopolitical effervescence in the Middle East, while traders eagerly await key US data releases.

US GDP growth expected to slow down significantly in Q4 after stellar Q3 

The United States Bureau of Economic Analysis will publish the first preliminary estimate of the fourth-quarter Gross Domestic Product at 13:30 GMT. Analysts forecast the US economy to have expanded at a 3% annualized rate, slowing down from the 4.4% growth posted in the previous quarter.

Week ahead – Markets brace for heightened volatility as event risk dominates

Dollar strength dominates markets as risk appetite remains subdued. A Supreme Court ruling, geopolitics and Fed developments are in focus. Pivotal Nvidia earnings on Wednesday as investors question tech sector weakness.

Official Trump price approaches breakout with mixed signals from traders

Official Trump (TRUMP) is trading at $3.50 at the time of writing, approaching its upper consolidation range. A breakout from this range could open the door for an upside move. On-chain data shows market indecision, with balanced flows between bulls and bears, signaling a lack of clear directional bias.