Gold Price Analysis: XAU/USD rebound eyes $1,856, Fed– Confluence Detector
- Gold reverses Thursday’s pullback from yearly resistance line.
- Bulls cheer firmer stock futures but yields test further upside ahead of the key FOMC.
- Russia-Ukraine tussles, Omicron headlines add to the risk catalysts, US Q4 Advances GDP, PCE Inflation eyed as well.
- Gold slides and rebounds in 2022

Gold (XAU/USD) begins Fed week on a firmer not around $1,840, extending the previous two-week uptrend.
The precious metal’s latest run-up could be linked to the market’s rush towards risk-safety ahead of the key weekly event, namely Wednesday’s Federal Open Market Committee (FOMC) meeting. The risk-off mood could also be linked to the mixed performance of the US Treasury bonds and mostly downbeat Wall Street.
The yellow metal stepped back from the yearly resistance line on Thursday, also declined on Friday, as markets weighed hawkish Fed concerns while geopolitical tensions surrounding Russia and Ukraine escalated. The pullback moves failed to last long so far on Monday as stock futures
It’s worth noting that the hawkish hopes from the Fed aren’t the only catalysts market players are bracing for this week as a slew of preliminary PMIs and GDP data also weigh on sentiment.
Read: Gold, Chart of the Week: Bulls pining for $1,850+, could be just a Fed away
Gold Price: Key levels to watch
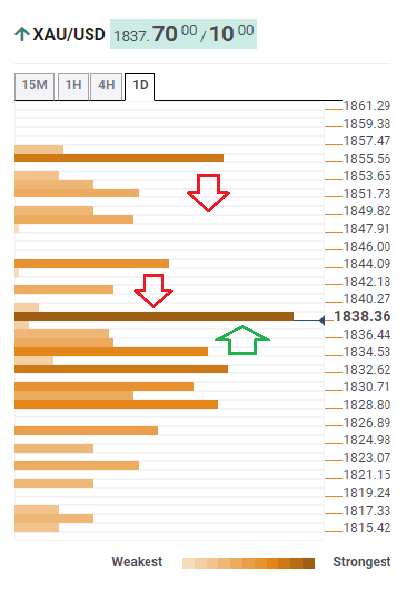
The Technical Confluences Detector shows that the gold price is battling the key hurdle around $1,838 comprising a cluster of SMA 200 on 15-Minutes, Fibonacci 61.8% one-day and previous highs on 1H, as well as 4H.
Given the metal’s ability to stay above multiple support zone surrounding $1,830, gold buyers are likely to keep the reins.
Among the key, supports are the $1,832 level that encompasses Fibonacci 38.2% one-week, 23.6% Fibonacci on one-day and Bollinger Band Lower on 15-Minutes.
Also acting as the key immediate support is the previous low on one-day surrounding $1,828, a break of which will set the tone for the metal’s further downside towards the $1,800 threshold.
Alternatively, the upper band of Bollinger on one-day joins the previous daily high to carve out $1,844 as an immediate upside hurdle.
However, major attention will be given to the $1,856 level including Pivot Point R1 on monthly and R3 on one-day.
It should be noted that a one-year-old resistance line near $1,848 acts as an extra hurdle to the north.
Here is how it looks on the tool
About Technical Confluences Detector
The TCD (Technical Confluences Detector) is a tool to locate and point out those price levels where there is a congestion of indicators, moving averages, Fibonacci levels, Pivot Points, etc. If you are a short-term trader, you will find entry points for counter-trend strategies and hunt a few points at a time. If you are a medium-to-long-term trader, this tool will allow you to know in advance the price levels where a medium-to-long-term trend may stop and rest, where to unwind positions, or where to increase your position size.
Author

Anil Panchal
FXStreet
Anil Panchal has nearly 15 years of experience in tracking financial markets. With a keen interest in macroeconomics, Anil aptly tracks global news/updates and stays well-informed about the global financial moves and their implications.


