Gold Price Analysis: XAU/USD needs to crack key $1803 level for additional recovery
- Weekly closing above Nov 30 low offers a ray of hope for XAU/USD.
- The bearish bias remains intact until gold stays below 21-DMA.
- The recovery mode could extend into Asia’s weekly opening.

Gold (XAU/USD) staged an impressive bounce Friday, having hit the lowest in seven months at $1761 in the Asian trades.
Despite the corrective pullback, gold ended the week on a negative note, as the rally in the US Treasury yields undermined the sentiment around the non-yielding gold.
From a short-term technical perspective, it was critical for gold to close the daily candlestick above the November 30 low of $1765, in order to offer some reprieve to the bulls (as explained here).
Gold Price Chart: Daily
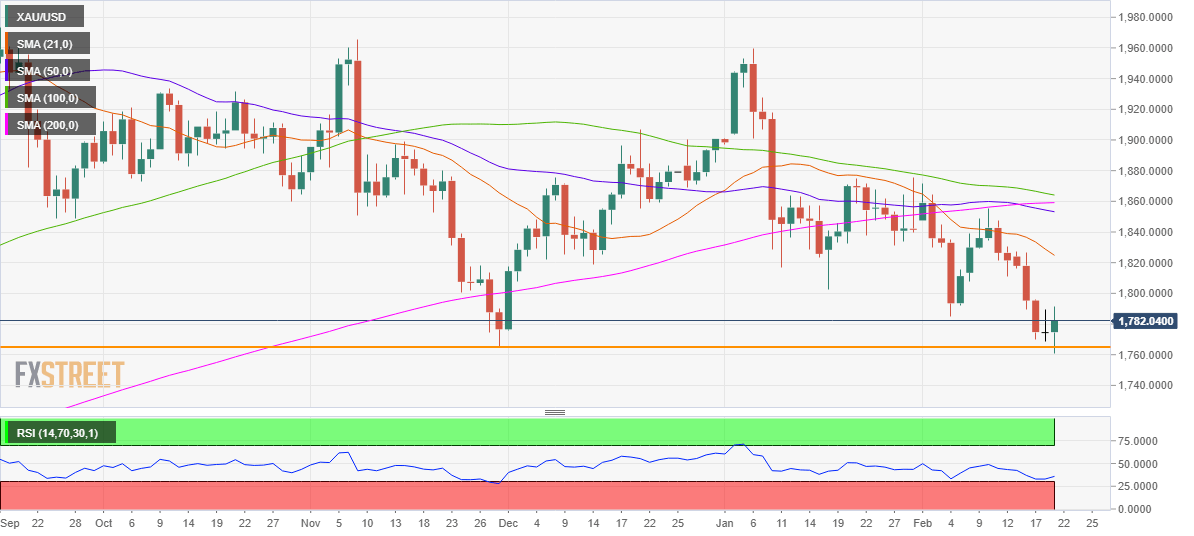
Although, it may not negate the bearish bias as long as the price holds below the downward-sloping 21-daily moving average (DMA) at $1825.
Ahead of that level, the buyers need to find acceptance above the $1790 level, above which the January low of $1803 could be tested.
The 14-day Relative Strength Index (RSI) has bounced-off lows, still remains below the midline (the 50 level), indicating that additional recovery could be in the offing.
If the downtrend resumes, the seven-month troughs could be retested at $1761, opening floors towards the June 2020 low at around $1720.
Gold Additional levels
Author

Dhwani Mehta
FXStreet
Residing in Mumbai (India), Dhwani is a Senior Analyst and Manager of the Asian session at FXStreet. She has over 10 years of experience in analyzing and covering the global financial markets, with specialization in Forex and commodities markets.


