Gold Price Analysis: XAU/USD slides below $1,850 level, fresh one-month lows
- Gold stays pressured near-weekly/monthly low, extends Friday’s losses.
- US dollar benefits from safe-haven bids ahead of FOMC, Treasury yields consolidate latest losses.
- Gold Weekly Forecast: XAU/USD tests key trend line ahead of FOMC meeting

Update: Gold continued losing ground through the mid-European session and dropped to fresh one-month lows, below the $1,850 level in the last hour. This marked the second consecutive day of heavy selling and was dragged the XAU/USD further away from the near five-month tops touched on May 1. The market has started pricing in a slightly less dovish Fed in the face of rising inflationary pressures. This, in turn, was seen as a key factor exerting pressure on the non-yielding yellow metal. It is worth recalling that the pace of inflation in the US climbed to a 13-year high in May. Hence, the key focus will remain on the upcoming FOMC meeting on June 15-16.
Heading into the key event risk, investors seemed reluctant to place any bearish bets around the US dollar. This was seen as another factor that acted as a headwind for dollar-denominated commodities, including gold. The ongoing downfall could further be attributed to some technical selling on a sustained break below the $1,870 horizontal support. A subsequent slide and acceptance below the $1,850 level might have already set the stage for additional weakness amid absent relevant market moving economic releases from the US. That said, the very important 200-day SMA, currently around the $1,840 region, could limit any further downside. This should act as a key pivotal point for short-term traders and help determine the next leg of a directional move.
Previous update: Gold price is on a downward spiral for the second straight day this Monday, as the bears remain relentless amid a broadly supported US dollar and steady Treasury yields. Gold price is looking to test the psychological $1850 support, shedding 1.08% on the day while reaching the lowest levels in four weeks. Speculation that the FOMC could hint at the taper timing at its monetary policy decision this Wednesday, is allowing the dollar to hold onto its recent rally at the expense of gold. Meanwhile, reports that getting the required number of Democrat votes "would be a long, uphill battle" on US President Joe Biden's infrastructure plans also exerts additional downside pressure on gold price.
With gold’s ongoing sell-off, the path opens up for a test of the 200-Daily Moving Average (DMA), located at $1840 after the bulls breached the critical ascending trendline support at $1879. However, gold price eyes a daily closing below the latter, in order to confirm a bearish reversal.
Read: Gold Price Forecast: Focus on daily close, as XAU/USD breaches key support ahead of FOMC
Gold (XAU/USD) licks its wounds around $1,864, following the drop to weekly/monthly low surrounding $1,860, ahead of Monday’s European session. In doing so, the gold sellers cheer Friday’s downside break of the key support as well as firmer US dollar.
The US dollar index (DXY) prints 0.07% gains, up for the second consecutive day, as market players seek solace in the greenback amid fears of the Fed’s tapering.
The indecision over Wednesday’s Federal Open Market Committee (FOMC) magnified following another upbeat US data, namely Michigan Consumer Sentiment Index. However, softer print of the inflation component allows the Fed policymakers to keep their defense to easy money policies.
Also on the same line could be the mixed releases of the latest US employment data and chatters over the supply crunch portraying a short-term challenge to the price pressure. It’s worth mentioning that a one-month low of the US inflation expectations, per 10-year breakeven inflation rate data from the St. Louis Federal Reserve (FRED), also favors the doves at the Fed.
Other than the pre-Fed jitters, the Western push to reinvestigate covid origins and dislike for China’s performance in Xinjiang and Hong Kong, per the latest Group of Seven (G7) meetings, should also favor the USD, which in turn weighs on the gold prices by the press time. Furthermore, uncertainty over US President Joe Biden’s infrastructure spending plan adds to the gold’s weakness.
Amid these plays, S&P 500 Future print mild gains but the US 10-year Treasury yields remain indecisive by the press time.
Moving on, a light calendar and an off in Australia, as well as China, could restrict gold’s short-term moves but the bears are less likely to relinquish controls.
Technical analysis
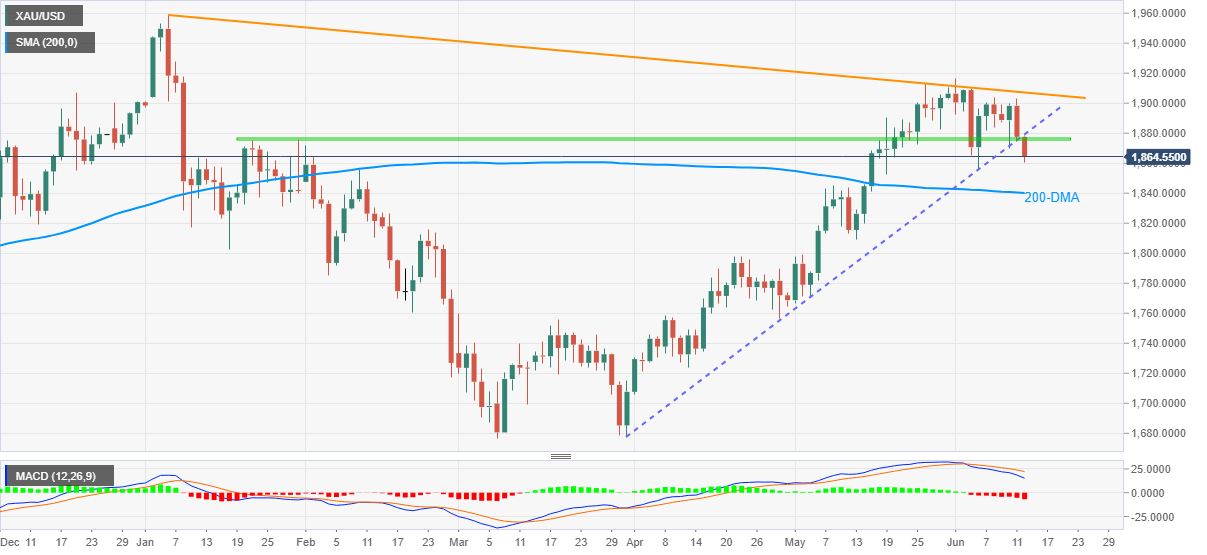
Gold’s clear break of $1,877-75 support confluence, comprising a 2.5-month-old rising trend line and a horizontal area from late January, keeps sellers hopeful amid the most bearish MACD signals since early May.
While the monthly bottom surrounding $1,855 can offer an intermediate halt, the metal’s declines towards testing 200-day SMA (DMA) level of $1,840 can’t be ruled out unless it jumps back beyond $1,877.
It’s worth noting that any further weakness past 200-DMA will make gold prices vulnerable enough to retest late February tops near $1,816.
On the contrary, a daily closing beyond $1,877 needs to cross the $1,900 threshold, as well as a falling trend line from early January near $1,907, to recall the gold buyers.
Following that, the previous month’s peak surrounding $1,917 and the yearly peak close to $1,960 should return to the charts.
Gold daily chart
Trend: Further weakness expected
Author

Anil Panchal
FXStreet
Anil Panchal has nearly 15 years of experience in tracking financial markets. With a keen interest in macroeconomics, Anil aptly tracks global news/updates and stays well-informed about the global financial moves and their implications.


