Gold Price Analysis: XAU/USD licks wounds in the Fed aftermath, $1969 still in sight? – Confluence Detector

Gold (XAU/USD) attempts a tepid rebound after a Fed-driven rally in the US dollar gathered steam and downed the metal 1% this Thursday. The Fed offered an optimistic outlook on the economy but doused hopes of further stimulus amid expectations of a faster recovery in the jobs market and higher tolerance for inflation.
The not-so-dovish Fed outcome pushed the US Treasury yields higher and weighed on the stocks alongside the yieldless gold. Increased odds of a deal on the US fiscal relief package further collaborated with the downside in gold. Ahead of the US Jobless Claims data, let’s see how it is positioned on the charts?
Gold: Key resistances and supports
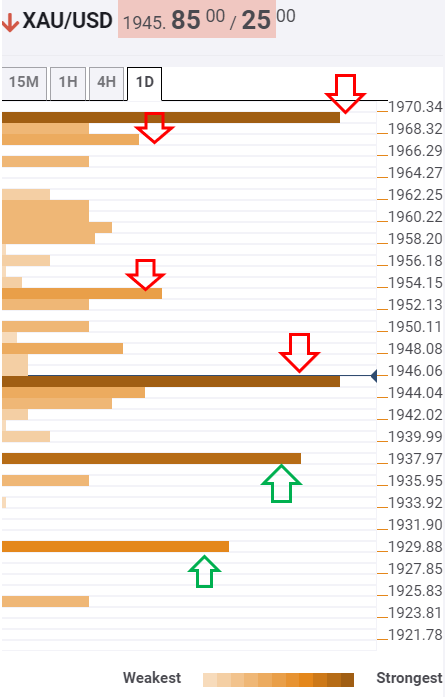
The Technical Confluence tool shows that gold is looking to regain the powerful resistance at $1946, which is the convergence of Fibonacci 38.2% one-month, Bollinger Band one-day Middle and SMA50 four-hour.
Bulls need conviction above the latter to add legs to the recovery momentum, with the next significant upside target seen at $1953, where the Fibonacci 23.6% one-week and SMA10 one-hour meet.
Further north, a bunch of minor resistances is stacked up around $1958/60 levels, above which the previous week high of $1966 will get tested. However, a sustained break above the robust barrier at $1969 for the bulls to resume its journey towards the $2000 mark.
Alternatively, acceptance below the $1937 support, the confluence of previous low on four-hour and pivot point one-day S2, could yield a drop towards the next relevant cushion at $1930. That cap is the intersection of the Fibonacci 61.8% one-week and SMA50 one-day.
Here is how it looks on the tool
About the Confluence Detector
The TCI (Technical Confluences Indicator) is a tool to locate and point out those price levels where there is a congestion of indicators, moving averages, Fibonacci levels, Pivot Points, etc. Knowing where these congestion points are located is very useful for the trader, and can be used as a basis for different strategies.
Author

Dhwani Mehta
FXStreet
Residing in Mumbai (India), Dhwani is a Senior Analyst and Manager of the Asian session at FXStreet. She has over 10 years of experience in analyzing and covering the global financial markets, with specialization in Forex and commodities markets.


