|

Gold Price Analysis: XAU/USD faces wall of resistance as silver remains in focus – Confluence Detector

The frenzy in stock markets has moved from GameStop and AMC to silver prices. XAG/USD hit an eight-year high before falling down back to previous levels. In the meantime, President Joe Biden is pushing to "go big" on stimulus, but instead of boosting gold, it is causing a sell-off in bonds. In turn, higher Treasury yields make the dollar more attractive. 

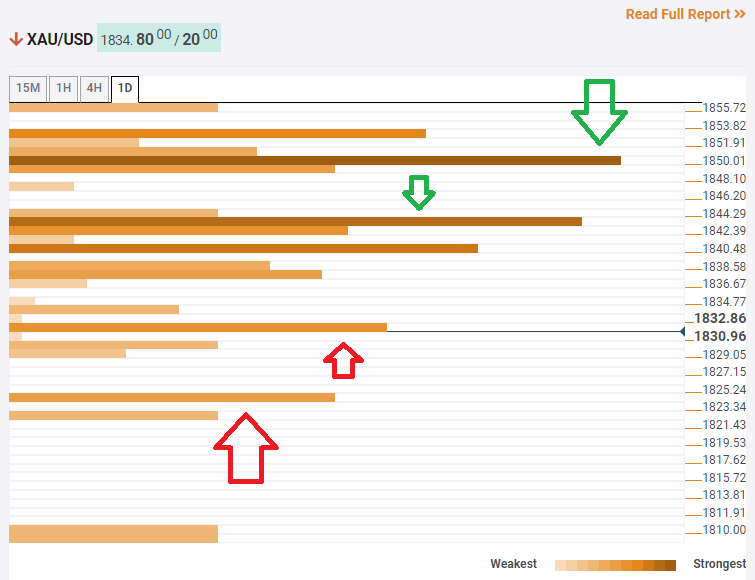
How is XAU/USD positioned on the technical graphs?

The Technical Confluences Indicator is showing that the precious metal faces some resistance around $1,843, which is a cluster including the Bollinger Band 1h-Upper, the Simple Moving Average 10-4h and the Fibonacci 38.2% one-day. 

Another strong cap awaits at $1,850, which is the convergence of two meeting points – the SMA 100-1h, the SMA 100-4h, and the SMA 50-4h. 

Some support awaits at $1,830, which is the meeting point of last week's low and the BB 4h-Lower. 

Another soft cushion is at $1,824, which is the confluence of the Pivot Point one-week Support 1 and the PP one-day S1. 

XAU/USD resistance and support levels

Confluence Detector

The Confluence Detector finds exciting opportunities using Technical Confluences. The TC is a tool to locate and point out those price levels where there is a congestion of indicators, moving averages, Fibonacci levels, Pivot Points, etc. Knowing where these congestion points are located is very useful for the trader, and can be used as a basis for different strategies.

Learn more about Technical Confluence

Author

Yohay Elam

Yohay Elam

FXStreet

Yohay is in Forex since 2008 when he founded Forex Crunch, a blog crafted in his free time that turned into a fully-fledged currency website later sold to Finixio.

More from Yohay Elam
Share:

Editor's Picks

EUR/USD looks to regain the 200-day SMA

EUR/USD regains some balance and trade just above 1.1600 the figure ahead of the opening bell in Asia. The pair initially dipped to the 1.1530 zone for the first time since November, always following the stronger US Dollar and the marked flight-to-safety in the context of the ongoing Middle East crisis
 

GBP/USD attacks 1.3300, refreshing three-month lows

GBP/USD is deep in the red near 1.3300, accelerating its downside to renew three-month lows in European trading on Tuesday. The ongoing escalation in the Iran war, combined with rising Oil prices, weighs negatively on the higher-yielding Pound Sterling as the US Dollar capitalizes on increased haven demand.

Gold bounces off lows, back above $5,100

Gold remains on the defensive, eroding part of the recent multi-day advance and managing to trade back above the $5,100 mark per troy ounce on Tuesday. The precious metal initially dropped just below the critical $5,000 threshold on the back of the persistent strength of the Greenback, higher US Treasury yields across the curve and investors' repricing of Fed rate cuts.

XRP risks extending losses as US-Iran war rages on

Ripple (XRP) has come under pressure, drifting lower to $1.35 at the time of writing on Tuesday. The over 2% correction looks poised to erase the previous day’s gains, which lifted the remittance token to $1.42.

Energy shock 2.0: Why rising Gas prices could hit the Euro

Even without a confirmed, sustained disruption, the mere risk to a key global energy chokepoint is enough to inject a significant premium into European Gas markets. And for the Euro, that matters.

Ripple falters amid sell-off jitters and negative funding rates

Ripple (XRP) has come under pressure, drifting lower to $1.35 at the time of writing on Tuesday. The over 2% correction looks poised to erase the previous day’s gains, which lifted the remittance token to $1.42.