|

Gold Price Analysis: XAU/USD faces critical resistance at $1,718 after the NFP – Confluence Detector

Gold has been on the back foot after Federal Reserve Chair Jerome Powell seemed reluctant to intervene and lower bond yields. Higher returns on US debt make the yieldless precious metal less attractive to investors. However, markets seem to have stabilized after US Nonfarm Payrolls rose by 379,000. 

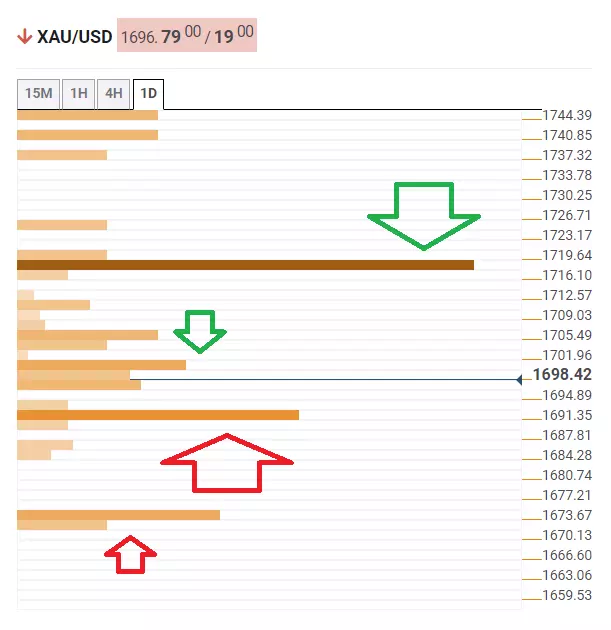
In the meantime, here is how XAU/USD is positioned on the charts.

The Technical Confluences Detector is showing that gold faces some resistance at around $1,700. Apart from being a round number, that level is also the convergence of the Bollinger Band one-day Lower, the Simple Moving Average 100-15m, the previous 4h-high, and the BB 1h-Upper. 

Critical resistance awaits at $1,718, which is a cluster of lines including the Pivot Point one-day Resistance 1, the previous monthly low, and the SMA 100-1h. 

Support awaits at $1,691, which is the confluence of the previous daily low, the PP one-week S1, and the previous 4h-low. 

Further down, the downside target is $1,673, which is the meeting point of the PP one-month S1 and the PP one-day S2.  

XAU/USD resistance and support levels

Confluence Detector

The Confluence Detector finds exciting opportunities using Technical Confluences. The TC is a tool to locate and point out those price levels where there is a congestion of indicators, moving averages, Fibonacci levels, Pivot Points, etc. Knowing where these congestion points are located is very useful for the trader, and can be used as a basis for different strategies.

Learn more about Technical Confluence

Author

Yohay Elam

Yohay Elam

FXStreet

Yohay is in Forex since 2008 when he founded Forex Crunch, a blog crafted in his free time that turned into a fully-fledged currency website later sold to Finixio.

More from Yohay Elam
Share:

Editor's Picks

EUR/USD seems fragile below 1.1700 as Middle East war boosts energy prices

The EUR/USD pair trades flat at around 1.1680 during the Asian trading session on Tuesday, but broadly seems vulnerable, being close to its five-week low. The major currency pair is under pressure as surging oil prices due to the United States-Israel war with Iran have increased the risks of higher inflation for the Old Continent.

GBP/USD hovers around 1.3400 with bearish pressure intact

GBP/USD edges higher after three days of losses, trading around 1.3400 during the Asian hours on Tuesday. The technical analysis of the daily chart indicates an ongoing bearish bias, as the pair trades within a descending channel pattern.

Gold sticks to gains above $5,350 amid sustained safe-haven demand; firmer USD caps gains

Gold sticks to its positive bias for the third straight day and trades above the $5,350 level heading into the European session on Tuesday. Concerns about a broader regional conflict in the Middle East continue to weigh on investors' sentiment and underpin demand for the traditional safe-haven bullion.

Stellar risks deeper losses as derivatives metrics turn negative

Stellar is trading red below $0.16 at the time of writing on Tuesday, after a slight recovery the previous day. Weakening derivatives data caps the recovery, while an unfavorable technical outlook projects a deeper correction for the XLM token in the upcoming days.

The market is not panicking it is repricing the probability distribution of Oil and time

At the end of the day, markets do not trade morality or geopolitics. They trade transmission channels. And the only channel that truly matters in this maelstrom runs through the price of energy and the time value of money.

Grass 20% bullish breakout defies broader market weakness

Grass (GRASS) is edging up above $0.30 at the time of writing on Monday. The token’s notable 20% intraday surge stands out amid heightened volatility in the broader crypto market.