Gold Price Analysis: XAU/USD eyes critical $1803 support amid firmer yields – Confluence Detector

Gold (XAU/USD) extends the three-day losing streak this Thursday, closing in on the $1800 level, as rising Treasury yields amid strengthening US economic recovery weigh negatively on the non-yielding gold. Further, uncertainty over the size of the US fiscal stimulus package keeps the gold traders unnerved.
Gold also tracks the decline in Silver, as the retail-buying frenzy in the white metal fizzles out. Focus remains on the US jobs data and sentiment on Wall Street for fresh trading impetus.
How is gold positioned on the technical charts?
Gold Price Chart: Key resistances and supports
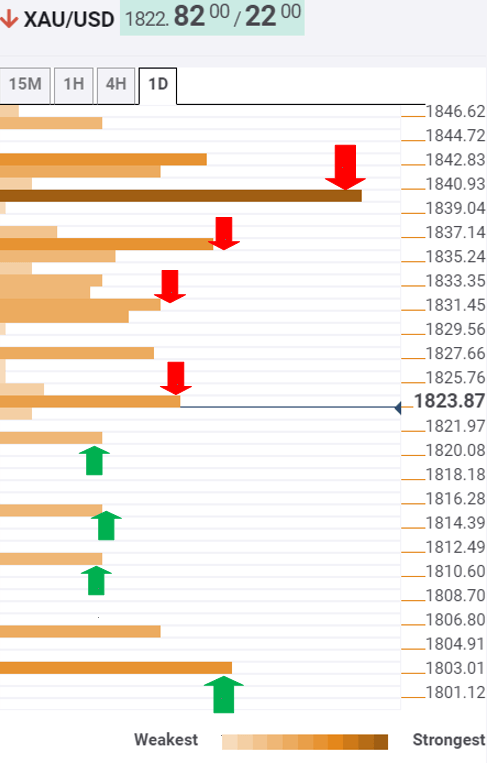
The Technical Confluences Indicator shows that gold is flirting with the $1820 support, which is the pivot point one-day S2.
Minor support awaits at $1815, the Bollinger Band one-day Lower. A failure to resist above the latter, gold prices could fall further to test the pivot point one-day daily S3 at $1812.
The sellers target the previous month low at $1803. However, the pivot point one-week S2 at $1807 could offer some temporary reprieve to the XAU bulls.
On the flip side, recapturing the pivot point one-week S1 hurdle at $1824 could expose the $1828 barrier, which is the confluence of the previous high one-hour and pivot point one-day S1.
The previous powerful support now resistance at $1831 could be tested, where the previous week low coincides.
Further up, the bulls could challenge the Fibonacci 38.2% one-day at $1837 en route $1840. That level is the convergence of the Fibonacci 61.8% one-day and Fibonacci 23.6% one-month.
Here is how it looks on the tool
About Confluence Detector
The TCI (Technical Confluences Indicator) is a tool to locate and point out those price levels where there is a congestion of indicators, moving averages, Fibonacci levels, Pivot Points, etc. Knowing where these congestion points are located is very useful for the trader, and can be used as a basis for different strategies.
Author

Dhwani Mehta
FXStreet
Residing in Mumbai (India), Dhwani is a Senior Analyst and Manager of the Asian session at FXStreet. She has over 10 years of experience in analyzing and covering the global financial markets, with specialization in Forex and commodities markets.


