Gold Price Analysis: XAU/USD can ignore US dollar bounce on the way to $1,900 – Confluence Detector

Although gold prices snap two-day winning streak while declining 0.21% to $1,889.50 during early Thursday, it’s the ability to stay beyond the key support near $1,887/88 keeps the buyers hopeful.
The yellow metal recently dropped after the US dollar index (DXY) bounced off the lowest since April 2018, flashed early in Asia. The DXY currently takes rounds to 89.64, up 0.04% on a day, following its extended south-run to 89.51 before a few minutes.
Trading sentiment remains sluggish amid a lack of major data/events and uncertainty over the US coronavirus (COVID-19) stimulus. However, the latest fears over the virus spread in the US, the UK and Japan seemed to have triggered the greenback’s retreat.
On the other hand, Brexit passage and vaccine developments, coupled with mixed activity numbers from China, probes the bears amid expectations of further stimulus from the US, Japan and China.
While the risk-on mood weighs on the greenback and favors gold in turn, any challenges to the trading sentiment could drag the yellow metal.
Looking forward, a light calendar and New Year Eve will challenge market moves.
Gold: Key levels to watch
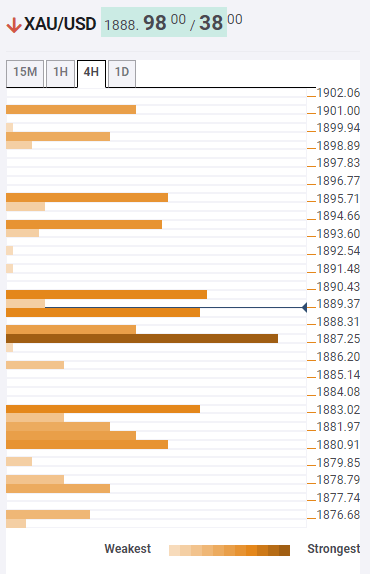
A sustained break of $1,887/88 confluence comprising 38.2% Fibonacci retracement of one day move (1D) and 61.8% Fibonacci retracement of the weekly move, coupled with the previous low on the 15-minute chart (15 Min), favor the gold buyers.
Though, the previous top on the 15 Min joins the earlier lows on the four-hour (4H) and the hourly (1H) moves, together with 23.6% Fibonacci retracement on 1D and lower band of the Bollinger on 15 Min, to probe the buyers around $1,890.
Should the bulls manage to cross the $1,890 immediate hurdle, the previous high on 1D and upper Bollinger band on the 4H, near $1,894, will precede the earlier top of 4H and 100-SMA on 1D, close to $1,896, to offer a bumpy road before a smooth drive past-$1,900.
Meanwhile, a downside break of $1,887 can recall the $1,883 level on the chart, including SMA 200 on 15 Min and 61.8% Fibonacci retracement level on 1D.
Here is how it looks on the tool
About Confluence Detector
The TCI (Technical Confluences Indicator) is a tool to locate and point out those price levels where there is a congestion of indicators, moving averages, Fibonacci levels, Pivot Points, etc. Knowing where these congestion points are located is very useful for the trader, and can be used as a basis for different strategies.
Author

Anil Panchal
FXStreet
Anil Panchal has nearly 15 years of experience in tracking financial markets. With a keen interest in macroeconomics, Anil aptly tracks global news/updates and stays well-informed about the global financial moves and their implications.

















