Gold Price Analysis: Recapturing $1965 is critical for XAU/USD bulls – Confluence Detector


Gold (XAU/USD) looks to extend its recent bullish momentum starting out a fresh week amid hopes of additional fiscal stimulus under US President-elect Joe Biden. Biden is a presumptive victor, as the legal challenges by the Trump campaign remain.

Markets also cheer the prospects of continuity of the current policy environment even on a divided government, with Republicans taking hold of the Senate. The upbeat market mood continues to dimmish the US dollar’s attractiveness as a safe-haven. However, the gains in the global stocks and rising coronavirus cases could likely limit the upside in the metal. Let’s see how gold is positioned on the charts.

Gold: Key resistances and supports

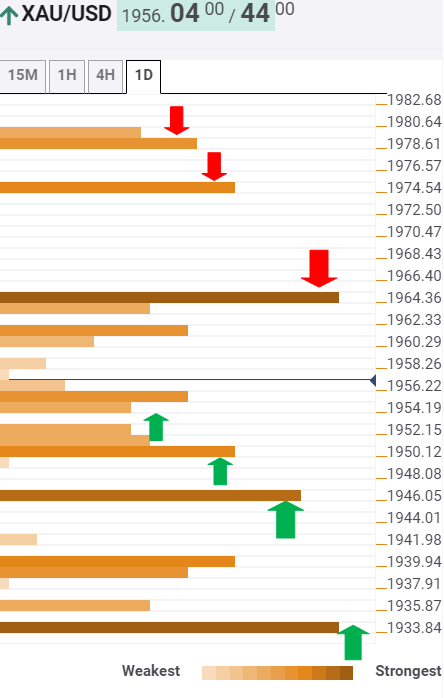
The Technical Confluences Indicator shows that the yellow metal remains on track to test the critical resistance at $1965, which is the pivot point one-month R2.

Ahead of that level, the confluence of the previous day high and Bollinger Band one-hour Upper at $1961 could challenge the bulls’ commitment.

Should the XAU bulls recapture the $1965 hurdle, the next upside target is seen at $1975, which is the intersection of the pivot point one-day S2 and Bollinger Band four-hour Upper.

Further up, $1980 is the level to beat for the bulls. That level is the Fibonacci 161.8% one-month.

Alternatively, a stack of healthy support levels is found $1953-51 levels, which could continue to guard the downside.

Acceptance below the SMA10 four-hour at $1950 is needed to fuel a corrective decline towards $1947, the convergence of the Fibonacci 61.8% one-day and Bollinger Band one-day Upper.

The next downside target is aligned at $1940, where the Fibonacci 23.6% one-week awaits.

The $1934 strong support, the previous month high, will be a tough nut to crack for the sellers.

Here is how it looks on the tool

fxsoriginal

About Confluence Detector

The Confluence Detector finds exciting opportunities using Technical Confluences. The TC is a tool to locate and point out those price levels where there is a congestion of indicators, moving averages, Fibonacci levels, Pivot Points, etc. Knowing where these congestion points are located is very useful for the trader, and can be used as a basis for different strategies.

Learn more about Technical Confluence

Share: Feed news

Information on these pages contains forward-looking statements that involve risks and uncertainties. Markets and instruments profiled on this page are for informational purposes only and should not in any way come across as a recommendation to buy or sell in these assets. You should do your own thorough research before making any investment decisions. FXStreet does not in any way guarantee that this information is free from mistakes, errors, or material misstatements. It also does not guarantee that this information is of a timely nature. Investing in Open Markets involves a great deal of risk, including the loss of all or a portion of your investment, as well as emotional distress. All risks, losses and costs associated with investing, including total loss of principal, are your responsibility. The views and opinions expressed in this article are those of the authors and do not necessarily reflect the official policy or position of FXStreet nor its advertisers. The author will not be held responsible for information that is found at the end of links posted on this page.

If not otherwise explicitly mentioned in the body of the article, at the time of writing, the author has no position in any stock mentioned in this article and no business relationship with any company mentioned. The author has not received compensation for writing this article, other than from FXStreet.

FXStreet and the author do not provide personalized recommendations. The author makes no representations as to the accuracy, completeness, or suitability of this information. FXStreet and the author will not be liable for any errors, omissions or any losses, injuries or damages arising from this information and its display or use. Errors and omissions excepted.

The author and FXStreet are not registered investment advisors and nothing in this article is intended to be investment advice.

Recommended content


Recommended content

Editors’ Picks

EUR/USD: The first upside target is seen at the 1.0710–1.0715 region

EUR/USD: The first upside target is seen at the 1.0710–1.0715 region

The EUR/USD pair trades in positive territory for the fourth consecutive day near 1.0705 on Wednesday during the early European trading hours. The recovery of the major pair is bolstered by the downbeat US April PMI data, which weighs on the Greenback. 

EUR/USD News

GBP/USD rises to near 1.2450 despite the bearish sentiment

GBP/USD rises to near 1.2450 despite the bearish sentiment

GBP/USD has been on the rise for the second consecutive day, trading around 1.2450 in Asian trading on Wednesday. However, the pair is still below the pullback resistance at 1.2518, which coincides with the lower boundary of the descending triangle at 1.2510.

GBP/USD News

Gold: Defending $2,318 support is critical for XAU/USD

Gold: Defending $2,318 support is critical for XAU/USD

Gold price is nursing losses while holding above $2,300 early Wednesday, stalling its two-day decline, as traders look forward to the mid-tier US economic data for fresh cues on the US Federal Reserve interest rates outlook.

Gold News

Crypto community reacts as BRICS considers launching stablecoin for international trade settlement

Crypto community reacts as BRICS considers launching stablecoin for international trade settlement

BRICS is intensifying efforts to reduce its reliance on the US dollar after plans for its stablecoin effort surfaced online on Tuesday. Most people expect the stablecoin to be backed by gold, considering BRICS nations have been accumulating large holdings of the commodity.

Read more

Three fundamentals for the week: US GDP, BoJ and the Fed's favorite inflation gauge stand out Premium

Three fundamentals for the week: US GDP, BoJ and the Fed's favorite inflation gauge stand out

While it is hard to predict when geopolitical news erupts, the level of tension is lower – allowing for key data to have its say. This week's US figures are set to shape the Federal Reserve's decision next week – and the Bank of Japan may struggle to halt the Yen's deterioration. 

Read more

Forex MAJORS

Cryptocurrencies

Signatures