Gold has staged a remarkable recovery, rising some nearly $90 from the lows – yet after crashing around $200 from the all-time highs of $2,075. Higher US bond yields – coming ahead of massive debt issuance – have been attributed to the precious metal's downfall.
However, after XAU/USD entered overbought conditions, a fall was on the cards, even overdue. Sino-American tensions, a bond auction, speeches by Federal Reserve officials, and other events are rocking markets. Russia's vaccine announcement is also in play.
How is gold positioned on the technical charts?
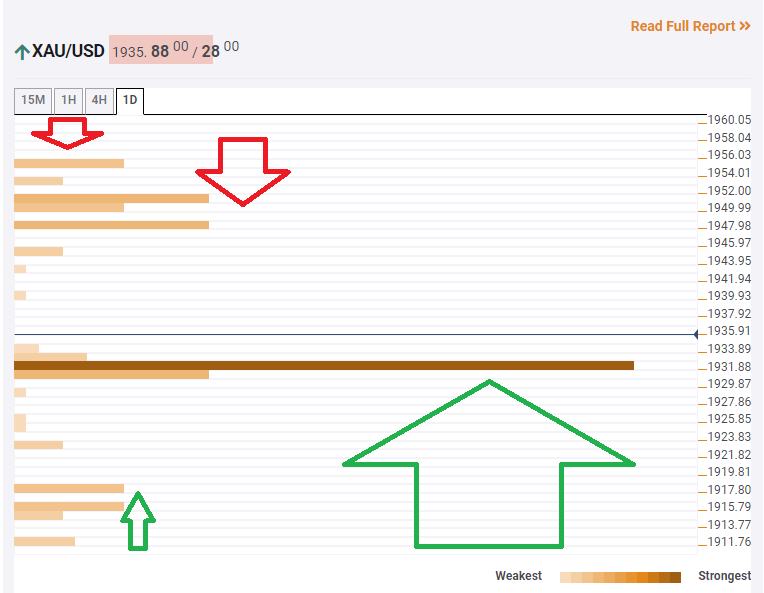
The Technical Confluences Indicator is showing that gold has overcome a strong convergence of lines at $1,931, turning resistance into support, and allowing for fresh gains. The noteworthy indicators meeting there including the Bollinger Band 15min-Middle, the Simple Moving Average 10-15m, the Fibonacci 23.6% one-month, and the Fibonacci 23.6% one-day.
Looking up, some resistance awaits at around $1,950, which is the confluence of the previous 4h-high and the Fibonacci 38.2% one-day.
The next cap is at $1,955, which is where the Simple Moving Average 10-4h hits the price.
Below $1,931, the next support line is at $1,917, which is a juncture of lines including the Bollinger Band 1h-Middle and the SMA 5-4h.
Key XAU/USD resistances and supports
Confluence Detector
The Confluence Detector finds exciting opportunities using Technical Confluences. The TC is a tool to locate and point out those price levels where there is a congestion of indicators, moving averages, Fibonacci levels, Pivot Points, etc. Knowing where these congestion points are located is very useful for the trader, and can be used as a basis for different strategies.
Information on these pages contains forward-looking statements that involve risks and uncertainties. Markets and instruments profiled on this page are for informational purposes only and should not in any way come across as a recommendation to buy or sell in these assets. You should do your own thorough research before making any investment decisions. FXStreet does not in any way guarantee that this information is free from mistakes, errors, or material misstatements. It also does not guarantee that this information is of a timely nature. Investing in Open Markets involves a great deal of risk, including the loss of all or a portion of your investment, as well as emotional distress. All risks, losses and costs associated with investing, including total loss of principal, are your responsibility. The views and opinions expressed in this article are those of the authors and do not necessarily reflect the official policy or position of FXStreet nor its advertisers. The author will not be held responsible for information that is found at the end of links posted on this page.
If not otherwise explicitly mentioned in the body of the article, at the time of writing, the author has no position in any stock mentioned in this article and no business relationship with any company mentioned. The author has not received compensation for writing this article, other than from FXStreet.
FXStreet and the author do not provide personalized recommendations. The author makes no representations as to the accuracy, completeness, or suitability of this information. FXStreet and the author will not be liable for any errors, omissions or any losses, injuries or damages arising from this information and its display or use. Errors and omissions excepted.
The author and FXStreet are not registered investment advisors and nothing in this article is intended to be investment advice.
Recommended content
Editors’ Picks
USD/JPY holds positive ground around 151.50 following Japanese CPI data
The USD/JPY pair holds positive ground for the second consecutive day near 151.45 on Friday during the early Asian trading hours. The cautious approach from the Bank of Japan to keep monetary conditions accommodative exerts some selling pressure on the Japanese Yen.
AUD/USD depreciates on risk aversion amid a stronger US Dollar
AUD/USD extends its losses for the second successive session on Friday. However, market activity is expected to be subdued due to light trading on Good Friday. Meanwhile, the US Dollar strengthens as recent data indicates annualized economic expansion in the United States, driven by consumer spending.
Gold price finishes Thursday’s session set to reach new all-time highs
Gold price rallied during the North American session on Thursday and hit a new all-time high of $2,225 in the mid-North American session. Precious metal prices are trending higher even though US Treasury yields are advancing, underpinning the Greenback.
Top 3 Price Prediction BTC, ETH, XRP: Retail watches from the sidelines with a bias for shorts
Bitcoin is showing strength as markets head into the Easter holidays. As it rises, altcoins are following suit, with Ethereum and Ripple posting almost similar gains. Meanwhile, there remains an unfilled CME Gap, with a lot of liquidity also resting above and below BTC price.
Bears have been standing before a steamroller so far this year
Despite a pushback on rate cuts from Christopher Waller, and what was supposed to be cautious trading sentiment ahead of critical US inflation data released later on Friday, the S&P 500 rose on Thursday, marking its best first-quarter performance in five years.