Gold has closed the last full week of a turbulent March around $1,626. How is it positioned as further coronavirus news is set to rock markets in a new week?
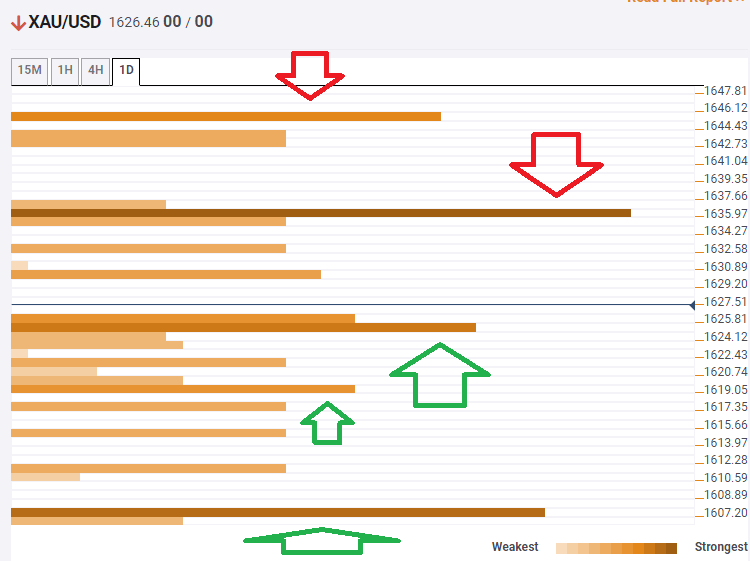
The Technical Confluences Indicator is showing that significant support awaits at $1,625, which is the convergence of the Simple Moving Average 10-4h, the SMA 100-15m, the Bollinger Band 15min-Middle, the SMA 5-1h, and the Fibonacci 61.8% one-day.
The next cushion is at $1,619, which is the meeting point of the Fibonacci 23.6% one-day and the BB 1h-Lower.
Further down, $1,607 is the strongest support line. It is the confluence of the Fibonacci 23.6% one-week and the Pivot Point one-week one-day Support 2.
Looking up, $1,635 is the key resistance line. It is a juncture of lines including the BB 4h-Upper, the Fibonacci 61.8% one-week, the PP one-day R1.
The upside target is $1,645, which is where the previous week's high hits the price.
Here is how it looks on the tool:
Confluence Detector
The Confluence Detector finds exciting opportunities using Technical Confluences. The TC is a tool to locate and point out those price levels where there is a congestion of indicators, moving averages, Fibonacci levels, Pivot Points, etc. Knowing where these congestion points are located is very useful for the trader, and can be used as a basis for different strategies.
This tool assigns a certain amount of “weight” to each indicator, and this “weight” can influence adjacents price levels. These weightings mean that one price level without any indicator or moving average but under the influence of two “strongly weighted” levels accumulate more resistance than their neighbors. In these cases, the tool signals resistance in apparently empty areas.
Information on these pages contains forward-looking statements that involve risks and uncertainties. Markets and instruments profiled on this page are for informational purposes only and should not in any way come across as a recommendation to buy or sell in these assets. You should do your own thorough research before making any investment decisions. FXStreet does not in any way guarantee that this information is free from mistakes, errors, or material misstatements. It also does not guarantee that this information is of a timely nature. Investing in Open Markets involves a great deal of risk, including the loss of all or a portion of your investment, as well as emotional distress. All risks, losses and costs associated with investing, including total loss of principal, are your responsibility. The views and opinions expressed in this article are those of the authors and do not necessarily reflect the official policy or position of FXStreet nor its advertisers. The author will not be held responsible for information that is found at the end of links posted on this page.
If not otherwise explicitly mentioned in the body of the article, at the time of writing, the author has no position in any stock mentioned in this article and no business relationship with any company mentioned. The author has not received compensation for writing this article, other than from FXStreet.
FXStreet and the author do not provide personalized recommendations. The author makes no representations as to the accuracy, completeness, or suitability of this information. FXStreet and the author will not be liable for any errors, omissions or any losses, injuries or damages arising from this information and its display or use. Errors and omissions excepted.
The author and FXStreet are not registered investment advisors and nothing in this article is intended to be investment advice.
Recommended content
Editors’ Picks

EUR/USD trims some gains, recedes to 1.1350
Despite losing some upside momentium, EUR/USD keeps the firm tone around the mid-1.1300s on Thursday, buoyed by renewed US Dollar weakness as investors grappled with the continued stalemate in US–China trade negotiations.

GBP/USD puts the 1.3300 level to the test
GBP/USD hovers around the 1.3300 area on Thursday, supported by a broad rebound in risk-sensitive assets, renewed weakness in the Greenback and lingering uncertainty over US–China trade talks.

Gold sticks to the bullish stance near $3,330
On Thursday, gold regained lost ground after two consecutive days of declines, with XAU/USD climbing back toward $3,300 per troy ounce following an earlier rally to roughly $3,370. The metal drew safe-haven buying as renewed fears of a US–China trade flare-up weighed on broader markets.

Bitcoin Price corrects as increased profit-taking offsets positive market sentiment
Bitcoin (BTC) is facing a slight correction, trading around $92,000 at the time of writing on Thursday after rallying 8.55% so far this week. Institutional demand remained strong as US spot Exchange Traded Funds (ETFs) recorded an inflow of $916.91 million on Wednesday.

Five fundamentals for the week: Traders confront the trade war, important surveys, key Fed speech Premium
Will the US strike a trade deal with Japan? That would be positive progress. However, recent developments are not that positive, and there's only one certainty: headlines will dominate markets. Fresh US economic data is also of interest.

The Best brokers to trade EUR/USD
SPONSORED Discover the top brokers for trading EUR/USD in 2025. Our list features brokers with competitive spreads, fast execution, and powerful platforms. Whether you're a beginner or an expert, find the right partner to navigate the dynamic Forex market.