|

Gold Price Analysis: Holding onto $1,493 critical to recovery in another corona-clouded week

Gold has recovered after the "sell-everything" mode in global markets battered by the coronavirus outbreak. The precious metal is a safe-haven asset and may have room to rise. What are the technical levels to watch on XAU/USD? 

The Technical Confluences Indicator is showing that gold has support at $1,493, which is the convergence of the Fibonacci 38.2% one-day, the Fibonacci 38.2% one-week 38.2% one-week, and the Bollinger Band 1h-Middle. 

Further support awaits at $1,487, which is the meeting point of the Simple Moving Average 10-4h and the SMA 5-1h. 

Resistance awaits at $1,500, which is the confluence of the SMA 5-one-day, the previous 4h-high, and the Fibonacci 23.6% one-day. 

The next cap is $1,505, where the 200-day SMA meets the price. 

The upside target is $1,516, where the BB 1h-Upper converges with the previous daily high.

Here is how it looks on the tool:
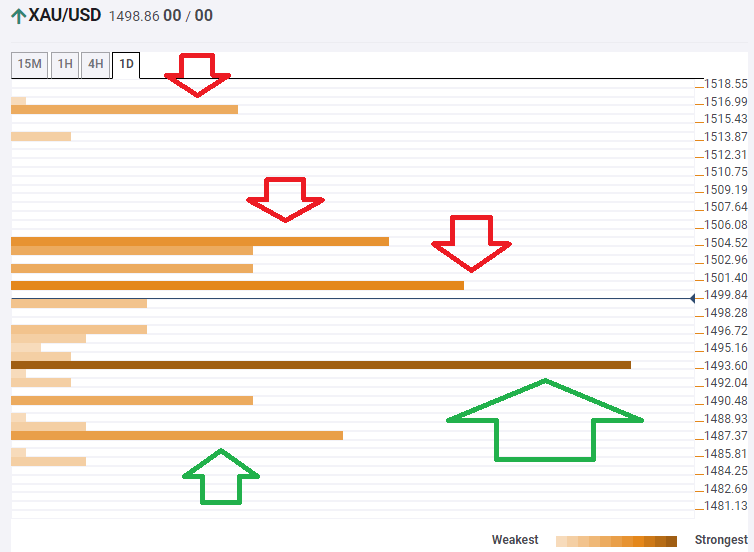
Gold Technical Confluence March 23 2020

Confluence Detector

The Confluence Detector finds exciting opportunities using Technical Confluences. The TC is a tool to locate and point out those price levels where there is a congestion of indicators, moving averages, Fibonacci levels, Pivot Points, etc. Knowing where these congestion points are located is very useful for the trader, and can be used as a basis for different strategies.

This tool assigns a certain amount of “weight” to each indicator, and this “weight” can influence adjacents price levels. These weightings mean that one price level without any indicator or moving average but under the influence of two “strongly weighted” levels accumulate more resistance than their neighbors. In these cases, the tool signals resistance in apparently empty areas.

Learn more about Technical Confluence

Author

Yohay Elam

Yohay Elam

FXStreet

Yohay is in Forex since 2008 when he founded Forex Crunch, a blog crafted in his free time that turned into a fully-fledged currency website later sold to Finixio.


More from Yohay Elam
Share:

Editor's Picks

AUD/USD turns south toward 0.6900 as USD firms up

AUD/USD sees fresh selling and drops toward 0.6900 in late Asian trading on Monday, as renewed US Dollar strength weighs on the pair amid lingering Middle East and Russia-Ukraine geopolitical tensions. Focus remains on Oil prices, Treasury bond yields, and RBA expectations for fresh trading impetus in the major.

USD/JPY retakes 158.00 amid hawkish BoJ bets, firmer USD

USD/JPY erases losses and retakes 158.00 in the Asian session on Monday, trading within a one-week-old range. Geopolitical uncertainty continues to underpin the US Dollar, despite fading Fed rate hike hopes, supporting the pair's rebound. However, further upside could be capped by hawkish BoJ expectations and looming intervention risks that could support the Japanese Yen.

Gold languishes below $4,200 amid high US yields

Gold trims some losses on Monday, but remains trapped within previous ranges, with upside attempts limited below $4,200 and with two-month lows of $4,110 at a short distance. The recent pullback on the US Dollar Index has provided some support for precious metals although the high US Treasury yields are keeping a floor on US Dollar dips so far.

Pi Network risks a steeper decline as bearish momentum builds

Pi Network extends losses below $0.090 maintaining a steady decline for the fifth consecutive day. The retail demand remains firm, with the notional value of active perpeutals holding above $10 million. The technical outlook for PI remains bearish as bearish momentum mounts.

ISM Services PMI expected to show robust US economy in September

The US ISM Services PMI is expected to improve marginally in September. The US services sector is expected to remain well into expansionary territory. Bets of further Fed tightening appear to have lost traction in the last few days.

The Euro is near a one-year low: Inflation could trigger its rebound, not its fall

EUR/USD has fallen to its lowest level since May 2025. The pair hit 1.1312 on Wednesday and trades well below the January peak of 1.2082. The decline reflects a powerful combination of US Dollar strength, geopolitical uncertainty and renewed concerns about Europe's exposure to higher energy prices.