|

Gold Price Analysis: Bears attack $1,700 inside short-term triangle

  • Gold prices snap three-day winning streak.
  • 200-bar SMA, 61.8% Fibonacci retracement will restrict downside below the triangle.
  • A three-week-old falling trend line adds to the resistance.

Gold drops to $1,702, down 0.18% on a day, during the Asian session’s trading on Wednesday. That said, the yellow metal keeps trading between the two-week-old symmetrical triangle.

As a result, sellers can aim for the weekly low surrounding $1,690 once the Gold prices drop below $1,700 round-figure. However, the pattern’s support around $1,674 could limit the bullion’s further downside.

If at all bears dominate past-$1,674, 200-bar SMA and 61.8% Fibonacci retracement of March 31 to April 14 upside, respectively, near $1,660 and $1,637, will be on their radars.

Alternatively, a sustained upside break of the said triangle’s resistance, at $1,709 now, can trigger the precious metal’s recovery towards a falling trend line from April 14 that stays around $1,730 at present.

It’s worth mentioning that the bullion’s rise past-$1,730 enables it to challenge the previous month top around $1,748 and aim for the year 2012 high close to $1,496.

Gold four-hour chart
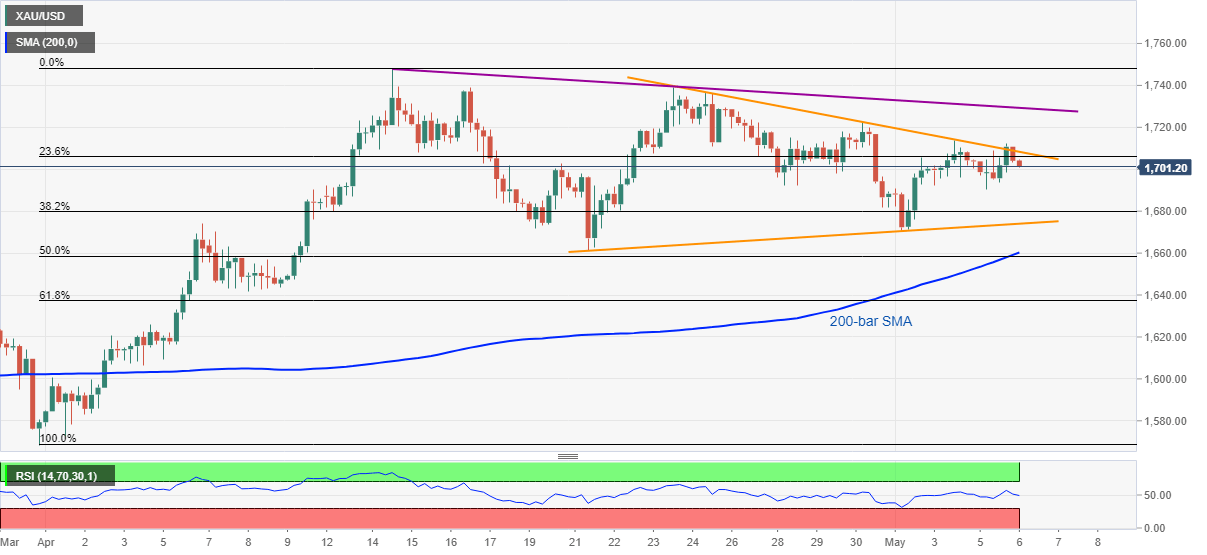
Trend: Further declines expected

Additional important levels

Overview
Today last price1702.34
Today Daily Change-2.68
Today Daily Change %-0.16%
Today daily open1705.02
 
Trends
Daily SMA201701.04
Daily SMA501640.39
Daily SMA1001597.49
Daily SMA2001543.87
 
Levels
Previous Daily High1712.27
Previous Daily Low1690.12
Previous Weekly High1728.71
Previous Weekly Low1670.72
Previous Monthly High1747.82
Previous Monthly Low1568.46
Daily Fibonacci 38.2%1703.81
Daily Fibonacci 61.8%1698.58
Daily Pivot Point S11692.67
Daily Pivot Point S21680.32
Daily Pivot Point S31670.52
Daily Pivot Point R11714.82
Daily Pivot Point R21724.62
Daily Pivot Point R31736.97

Author

Anil Panchal

Anil Panchal

FXStreet

Anil Panchal has nearly 15 years of experience in tracking financial markets. With a keen interest in macroeconomics, Anil aptly tracks global news/updates and stays well-informed about the global financial moves and their implications.


More from Anil Panchal
Share:

Editor's Picks

GBP/USD keeps the firm tone above 1.3600

GBP/USD clings to its daily gains, although it gives back some of them and recedes toward the 1.3630-1.3620 band on Thursday. Cable’s uptick comes despite the modest bounce in the Greenback, while investors gear up for key data releases on the UK calendar on Friday.

EUR/USD treads water near 1.1670

EUR/USD gives away all its initial gains and receded to the sub-1.1700 region. The US Dollar’s late recovery has dragged the pair lower, leaving it practically unchanged following the NA session on Thursday. In the meantime, investors gear up for the release of preliminary S&P Global Manufacturing and Services PMIs on both sides of the Atlantic on Friday.

Gold trims losses, back above $4,500

Gold manages to regain some composure and reclaim the area beyond the key $4,500 mark per troy ounce on Thursday. The yellow metal’s daily decline comes amid the humble improvement in the US Dollar while US Treasury yields remain on the rise following Wednesday’s marked retracement across the curve.

XRP extends rally as bullish technical signals underpin breakout attempt

Ripple holds in bullish hands, as price action extends above $1.16 at the time of writing on Thursday. Since Monday, the cross-border remittance token has surged by more than 20%, reflecting a steady growth in risk-on sentiment. The broader crypto market sentiment is on an upward roll at 62 in the Greed territory on Thursday, up from 46 the previous day, according to the Fear & Greed Index.

Why long bonds have repriced the cost of money
The 30-year Treasury is 12 basis points below its highest level since before the financial crisis. Not its highest since 2023, or since the tightening cycle, but since June 12, 2007, the last time the longest bond in the world's deepest market yielded what it yields on Thursday. Getting there took two attempts and most of the year.
$20 billion offered, $2 billion taken: Why Treasury doubled its buyback cap

The US Treasury moved off its own calendar on Wednesday, and that is the part worth sitting with. At 12:32 GMT, the department said it would at least double the size of liquidity support buyback operations in the 10-year to 20-year and 20-year to 30-year sectors, lifting the maximum from $2 billion per operation to at least $4 billion, effective September 9 and running to November 4.















