Gold Price Analysis: Battle lines well-mapped for XAU/USD ahead of critical US data – Confluence Detector

Gold (XAU/USD) continues to face rejection at higher levels, as the US dollar attempts a tepid bounce from multi-week lows amid covid vaccine and China concerns-led risk-aversion. Also, investors could resort to profit-taking on their dollar trades after the recent sell-off and ahead of the critical US Jobless Claims and Retail Sales data.
Gold fell on Wednesday amid a steady recovery in the US Treasury yields across the curve. However, the metal remained in a familiar range, with a breakout awaited on the US data release.
In the meantime, how is gold positioned on the charts?
Gold Price Chart: Key resistance and support levels
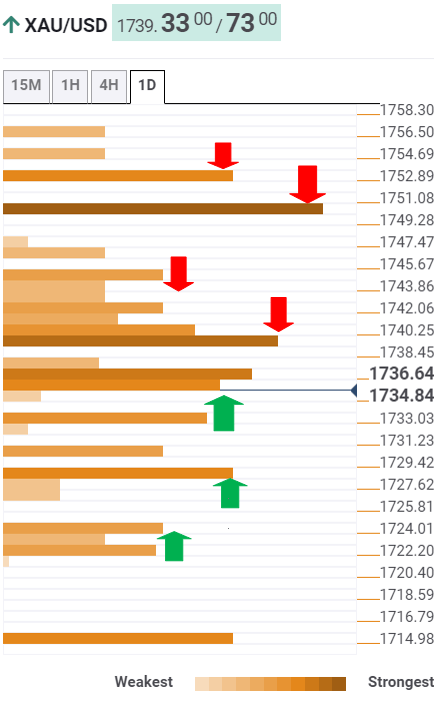
The Technical Confluences Detector shows that gold’s upside is capped near $1741, where the Fibonacci 38.2% one-day, SMA50 four-hour and Bollinger Band four-hour Middle converge.
A dense cluster of healthy resistance levels then awaits the XAU bulls around $1745, the intersection of the SMA5 one-day, Fibonacci 61.8% one-day and Fibonacci 38.2% one-week.
Further, fierce resistance at $1750 will continue to test the bulls’ commitments. At that level, the previous day high coincides with the Fibonacci 23.6% one-week.
The next upside target is aligned at the pivot point one-month R1 at $1753.
On the flip side, strong support near $1735, the confluence of the Fibonacci 23.6% one-day, SMA10 one-day and Fibonacci 61.8% one-week, is likely to guard the immediate downside.
The previous day low of $1733 could offer some support to the XAU bulls, below which powerful cap awaits at $1728, the Fibonacci 61.8% one-month.
The meeting point of the pivot point one-month and Tuesday’s low at $1724 could be a tough nut to crack for the sellers.
Here is how it looks on the tool
About Technical Confluences Detector
The TCD (Technical Confluences Detector) is a tool to locate and point out those price levels where there is a congestion of indicators, moving averages, Fibonacci levels, Pivot Points, etc. Knowing where these congestion points are located is very useful for the trader, and can be used as a basis for different strategies.
Author

Dhwani Mehta
FXStreet
Residing in Mumbai (India), Dhwani is a Senior Analyst and Manager of the Asian session at FXStreet. She has over 10 years of experience in analyzing and covering the global financial markets, with specialization in Forex and commodities markets.


